")
")
CO2 Snow Depth and Subsurface Water-Ice Abundance in the Northern Hemisphere of Mars
I.G.Mitrofanov1*, M.T.Zuber2, M.L.Litvak1, W.V.Boynton3, D.E.Smith4, D.Drake5, D.Hamara3, A.S.Kozyrev1, A.B.Sanin1, C.Shinohara3, R.S.Saunders6 and V.Tretyakov1
1 Space Research Institute, Russian Academy of Sciences, Moscow, 117997, Russia.
2Department of Earth, Atmospheric, and Planetary Sciences, Massachusetts Institute of Technology, Cambridge, MA 02139–4307, USA.
3Lunar and Planetary Laboratory, University of Arizona, Tucson, AZ 85721, USA.
4 Laboratory for Terrestrial Physics, NASA–Goddard Space Flight Center, Greenbelt, MD 20771, USA.
5Tech-Source, Santa Fe, NM 87505, USA.
6NASA Headquarters, Washington, DC 20514, USA.
*To whom correspondence should be addressed. E-mail: This email address is being protected from spambots. You need JavaScript enabled to view it.
Abstract - Observations of seasonal variations of neutron flux from the high-energy neutron detector (HEND) on Mars Odyssey combined with direct measurements of the thickness of condensed carbon dioxide by the Mars Orbiter Laser Altimeter (MOLA) on Mars Global Surveyor show a latitudinal dependence of northern winter deposition of carbon dioxide. The observations are also consistent with a shallow substrate consisting of a layer with water ice overlain by a layer of drier soil. The lower ice-rich layer contains between 50 and 75 weight % water, indicating that the shallow subsurface at northern polar latitudes on Mars is even more water rich than that in the south.
DOI: 10.1126/science.1084350 - http://www.sciencemag.org/content/300/5628/2081
Mars undergoes seasons in which volatile species, carbon dioxide (CO2) and, to a much lesser extent, water are exchanged between the atmosphere and surface (1, 2). The winter deposition in both hemispheres consists of condensed CO2 whose accumulation and sublimation are controlled mainly by solar insolation (3). Throughout the dark autumn and winter seasons, CO2 accumulates on the surface (4) from the pole to mid-latitudes. In spring, as sunlight returns, CO2 sublimes back into the atmosphere, exposing the ground surface and residual ice caps at the poles. The north polar residual cap is composed of water ice (5), but the south polar residual ice cap retains CO2 year-round (6, 7). Water is much less abundant in the atmosphere than CO2 (8), but a large amount of water ice is believed to be sequestered in the shallow substrate (9, 10), perhaps representing the frozen remnant of water that once flowed freely on the surface in earlier epochs (11, 12). The seasonal cycling of martian volatiles and the inventories in primary reservoirs have implications for understanding present meteorological processes as well as climate change. To this end, we combine new observations of the neutron flux by HEND (Mars Odyssey) in the northern hemisphere with measurements of topographic height changes from MOLA (Mars Global Surveyor) to measure the thickness of condensed CO2 and to estimate the water-ice content of the shallow subsurface at northern polar latitudes.
Nuclear emission from Mars is produced within the uppermost surface layer, where energetic charged particles of galactic cosmic rays interact with nuclei of subsurface material and produce secondary neutrons. The neutrons interact with these nuclei, generating emission of nuclear gamma-ray lines and moderating down to thermal energy (13–15). Each nucleus is characterized by a set of particular spectral lines of gamma rays, measurement of which permits a determination of the soil composition in the layer of neutron production, ∼1 to 2 m thick.
The Mars Odyssey spacecraft measures induced nuclear emission from Mars with the three detectors of the Gamma-Ray Spectrometer (GRS) suite (16). The GRS includes a germanium (Ge) sensor for detection of nuclear lines of gamma rays, a neutron spectrometer (NS) for detection of thermal and fast neutrons (17), and a high-energy neutron detector (HEND) (18).
Among all elements, hydrogen is the most straightforward to detect by nuclear emission. First, a leakage flux of neutrons from the surface depends on the presence of hydrogen. Collisions of energetic neutrons with protons (hydrogen nuclei) lead to their rapid moderation down to thermal energies in comparison with much slower moderation by heavier nuclei such as Si or O. Second, slow neutrons are efficiently captured by hydrogen, with the production of deuterium in the excited state followed by emission of photons at 2.2 MeV. Consequently, a reduced flux of high-energy neutrons and an excess of 2.2-MeV photons over a region of Mars, compared to typical values, indicate the presence of hydrogen in the layer of neutron production. Water is the most abundant substance that contains hydrogen, and therefore the enhancement of hydrogen can be taken as a proxy for the enhancement of water (19).
Soon after the initiation of the Odyssey mapping stage, the two neutron instruments detected a strong depression of high-energy neutrons from high southern latitudes >60°S of Mars (17, 18). During the same period, the GRS detected a strong excess of 2.2-MeV photon flux from the same region (19). These observations were interpreted collectively as evidence for an extensive water ice–bearing region, poleward of 60°S latitude, characterized by 35 ± 15 weight % (wt %) water ice, overlain by a layer of drier soil with a latitude-dependent thickness within 10 to 100 cm (17–19).
Maps of neutron flux (17, 18) were obtained during the southern hemisphere summer, at solar longitude Ls ∼ 330° (20), when the ground at high northern latitudes was covered by CO2 that condensed from the martian atmosphere during the winter night (4). Mars Odyssey has now collected data for more than half a martian year and includes temporal coverage of the winter-to-summer transition in the north. The difference in epithermal neutron flux (21) from the northern hemisphere of Mars for winter (Ls = 330° to 360°) compared to summer (Ls = 90° to 165°) reflects the seasonal change in the composition of material in the layer of neutron production (Fig. 1).
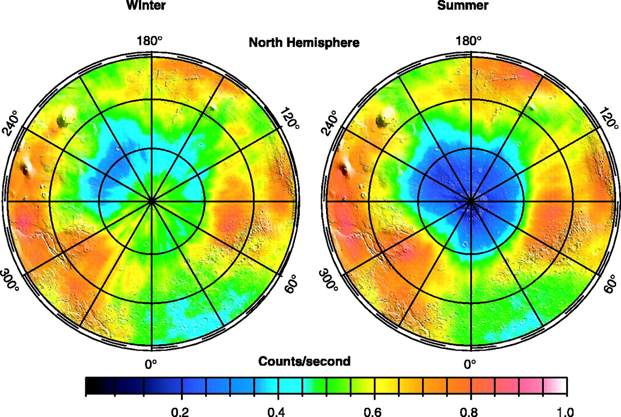
Fig. 1. Polar maps of epithermal neutron flux (21) from northern hemisphere of Mars as measured during northern winter (Ls = 330° to 360°) and summer (Ls = 100° to 165°) (20). The maps have a pixel resolution of 1° by 1° (60 km by 60 km) and have been smoothed with linear averaging in 5° by 5° cells (40). The count rate of the neutron flux has been normalized by its maximum value, which is observed in the equatorial Solis Planum region at 270°E, 25°S (33). The neutron flux is superposed on a shaded relief map of MOLA topography (25).
Figure 2 highlights this change for four latitudinal annuli: 80° to 85°N, 75° to 79°N, 70° to 74°N, and 65° to 69°N. High count rates of neutrons at Ls = 330° to 360° correspond to the end of northern hemisphere winter, when the dry layer of CO2 covered the high-latitude surface of the northern hemisphere (22) (Fig. 2). The map for this season does not show a strong signature of water ice at high latitudes, except for a localized area north of the Tharsis volcanic province in Vastitas Borealis (Fig. 1, left; longitudes ∼180° to 270°E). The absence of a water signature at other longitudes around the pole indicates that neutron production occurred primarily in the CO2 layer.
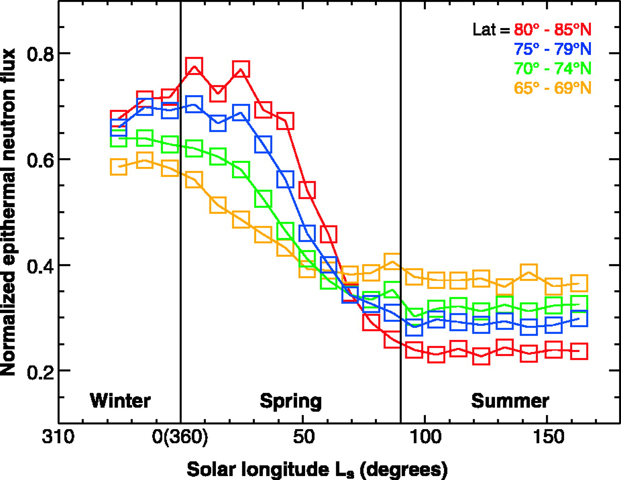
Fig. 2. Seasonal variation of average fluxes of epithermal neutrons for latitudinal annuli in the northern hemisphere: 80° to 85°N (red), 75° to 79°N (blue), 70° to 74°N (green), and 65° to 69°N (yellow). The normalized (33) neutron flux is shown by square symbols where the size of the symbol corresponds to the statistical error.
In early spring, when the surficial cover of CO2 sublimes, the layer of neutron production begins to include the soil. Because the ground contains more water than the layer of CO2 deposition, the flux of neutrons decreases with increasing Ls (Fig. 2). The neutron flux stabilizes at Ls = 60° for the annulus 65° to 69°N, at Ls = 90° for the 70° to 74°N and 75° to 79°N annuli, and at Ls = 100° for the annulus 80° to 85°N, at which points there is virtually no condensed CO2 on the soil in the northern hemisphere. Direct observations at the same locations by previous missions confirm the absence of surficial CO2 deposition after similar seasons of the Martian year (23). The corresponding summer map for Ls = 100° to 165° is characterized by a decrease in the neutron flux poleward of 50° to 60°N (see boundary of blue color in Fig. 1, right), at which time the layer of neutron production in this extensive region is contributed by a soil with water ground ice.
The previous discussion indicates that the neutron flux scales with the thickness of the layer of CO2, such that a higher flux of neutrons corresponds to a thicker deposit of CO2. To infer depth of CO2 from the neutron-flux observations, we compared the neutron flux from HEND to observations of surface height change from MOLA (24, 25) (Fig. 3). During the MGS mapping and extended missions, MOLA measured temporal changes of the height of the martian surface that correlated with the seasonal cycle of deposition and sublimation of CO2 (26). The MOLA observations (27) were obtained one Mars year earlier than those from HEND, but data from these two instruments show a direct correlation between the thickness of CO2 deposition and neutron flux for corresponding seasons (28).
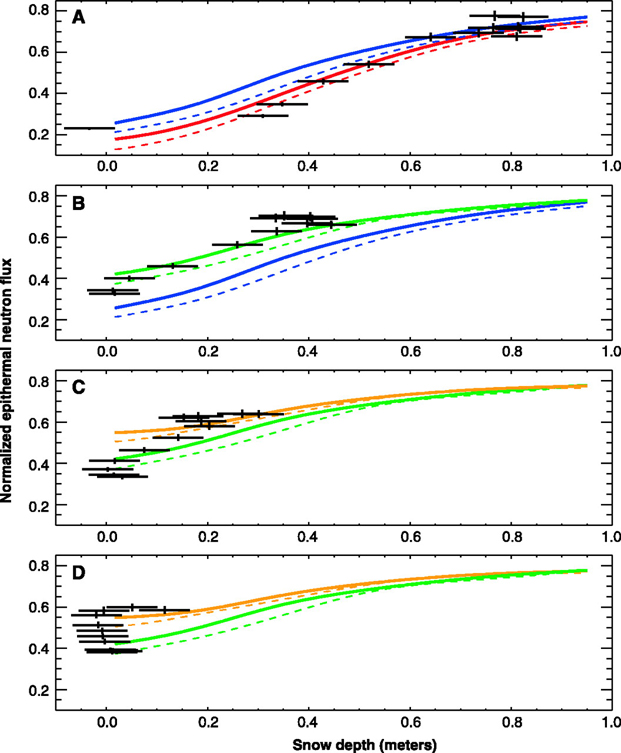
Fig. 3. Correspondence between neutron flux and condensed CO2 depth for northern latitude belts. The x axis corresponds to MOLA measurements of condensed CO2 depths, and the y axis corresponds to normalized (33) neutron flux observed by HEND. Data points with errors (black crosses) are shown for latitudinal annuli: (A) 80° to 85°N, (B) 75° to 79°N, (C) 70° to 74°N, and (D) 65° to 69°N. The vertical lines on the crosses represent 1σ statistical errors of the neutron flux from HEND, whereas the horizontal lines represent the ±5 cm accuracy of the MOLA data. These data points for MOLA and HEND correspond to a range of Ls from 330° to 112° (20). HEND data cover continuously the interval of Ls beginning at Ls = 330° (18 February 2002) and ending at Ls = 112° (22 December 2002). MOLA observations were combined for two different seasons from 28 February 1999 to 20 March 1999 (Ls = 103° to 112°) and from 1 April 2000 to 15 November 2000 (Ls = 329° to 77°). Calculations for the four-layer model are represented by solid and dashed curves for 50 wt % H2O and 75 wt % H2O in the lower layer, respectively. The variable depths of the condensed CO2 layer hCO2 are shown along the x axis. Red, blue, green, and yellow curves represent the set of drier layers with column densities hdry = 10, 20, 40, and 60 g cm–2.
MOLA and HEND observations are the most complementary when the thickness of CO2 changes between ∼20 cm and ∼1 m (Fig. 3A). For CO2 layer thicknesses of ≥1 m, the flux of neutrons becomes constant because the layer of neutron production would include dry ice only. On the other hand, neutron measurements are more sensitive for thin layers of CO2 (≤20 cm) where MOLA reaches its resolution limit (26). Indeed, for the late spring, the HEND neutron data continue to show a decrease of CO2, whereas the MOLA data display random deviations around zero thickness. This effect is seen for latitude belts 75° to 79°N, 70° to 74°N, and 65° to 69°N (Fig. 3, B to D), where HEND data still permit detection of CO2 thickness at the scale of centimeters.
To interpret the neutron flux in terms of subsurface volatile content, we used the simplest four-layer model of suborbital material distribution (29). The uppermost layer is the martian atmosphere of CO2 with constant column density hatm = 20 g cm–2. The second layer is the surficial cover of condensed CO2, with variable thickness hCO2 in m and density ∼1 g cm–3 (27). The shallow substrate consists of the bottom layer with water ice overlain by a layer of drier soil. The upper layer has variable thickness hdry. We considered four cases with different column densities hdry = 60, 40, 20, and 10 g cm–2. For all cases, we assumed for the upper layer 97 wt % soil with a Pathfinder composition (30) and 3 wt % water (31, 32). Two options were considered for the shallow substrate with ground ice: in the first case it contains 50 wt % soil with Pathfinder composition and 50 wt % water ice, and in the second it contains 25 wt % soil with Pathfinder composition and 75 wt % water ice. This ice-rich layer has a thickness much greater than 2 m.
To compare the model calculation with HEND observations, we normalized the calculated flux of epithermal neutrons by that for a homogeneous soil with 98.5 wt % Pathfinder composition (30) and 1.5 wt % water. This reference value corresponds to the maximum observed flux of epithermal neutrons, which occurs in the Solis Planum region (270°E, 25°S) (Fig. 1) (33).
The calculated relations between neutron flux and the thickness of deposited CO2 (Fig. 3) quantify how the flux of neutrons increases with the changing thickness of winter CO2 deposition. The relations are different for different column densities hdry of the upper layer. For a larger column density hdry, the difference between data for winter with hCO2 > 1 m and for summer with hCO2 = 0 is smaller because either dry CO2 ice or dry soil represents the primary contribution to the layer of neutron production. When the column density hdry is smaller than 10 g cm–2, the difference between data for winter with hCO2> 1 m and for summer with hCO2 = 0 is much larger because the bottom layer with water ice dominates in the layer of neutron production for the second case.
Comparison of the most reliable measurements (hCO2 = 20 to 80 cm) by HEND and MOLA in the highest latitude annulus 80° to 85°N (see crosses in Fig. 3A) is consistent with a model characterized by a thickness of winter CO2 deposition of 80 cm and by a relatively small column density, hdry ∼10 g cm–2 (34), of the upper soil layer. For a changing thickness hCO2 of deposited CO2, the slope of the model curves indicates a 50 wt % to as high as 75 wt % content of water ice in the ice-rich layer (Fig. 3A). When Odyssey collects data for the annulus 80° to 85°N, the HEND field of view corresponds to a circle with angular diameter of ∼10° on the surface. Therefore, the average flux of neutrons for this annulus corresponds to emission from the surface of the residual ice cap at 270° to 90°E and from the layered terrains at 90° to 180°E. Therefore, our estimation of hdry represents the mean value for these two parts of the north polar region. This value could serve as the upper limit for the thickness of dry deposits over the residual ice cap at 270° to 90°E and as the lower limit for the thickness of drier soil at layered terrains at 90° to 180°E.
The data for belts at moderate polar latitudes 75° to 79° and 70° to 74°N (Fig. 3, B and C) are consistent with a model with a column density of the drier layer hdry ∼ 40 g cm–2 and with a water-ice content in the bottom layer of about 50 to 75 wt % (green curves in Fig. 3, B and C). According to this model, the maximum flux of neutrons leads to a maximum thickness of CO2 winter deposits of about 55 and 40 cm for the 75° to 79° and 70° to 74°N annuli, respectively. These thicknesses from the model-dependent HEND data interpretation are about 10 cm larger than direct measurements from MOLA (Fig. 3, B and C), but the difference is comparable to the accuracy of the MOLA measurements (26). Alternatively, the difference might be explained by actual differences in two different years of MOLA and HEND observations.
For the annulus that includes latitudes 65° to 69°N (Fig. 3D), the MOLA instrument cannot measure condensed CO2 depth changes due to accumulation below the level of resolution (26, 27). However, it is possible to make a model-dependent estimation of the thickness of winter CO2 deposition from the MOLA-calibrated HEND data. The neutron flux for summer with hCO2 = 0 implies a column density of the drier layer hdry ≥ 40 g cm2, and a water-ice content in the lower layer of about 50 to 75 wt % (Fig. 3D, green curve). According to these model parameters for the shallow substrate, the maximum neutron flux for winter corresponds to 30 cm of CO2 deposition on the surface within this annulus.
Therefore, the thickness of winter CO2 deposition in the north decreases from 0.8 m within the 80° to 85°N annulus down to about 0.3 m within the 65° to 69°N annulus. The total amount of condensed CO2 in the north is on the order of 2 × 10¹⁸ g.
Data for winter-to-summer changes in neutron flux in the northern hemisphere indicate the presence of a large region of ground ice at northern polar latitudes (Fig. 1). For 50 wt % water the volume of ice is about 70%, and for 75 wt % water the ice volume is greater than 90%; the entire range of acceptable solutions is much larger than could be associated with soil porosity (19). Thus, the dominant volumetric constituent of the shallow substrate is water ice. The 50 wt % water-ice content for the north is comparable to the initial estimate of 35 ± 15 wt % for the southern hemisphere (19), as deduced from the data collected during southern hemisphere summer from the Odyssey GRS suite (17–19). The current results indicate that the water-ice content at northern polar latitudes is even greater than that in the south. It should be understood that these simple models of a shallow substrate are just plausible examples of distributions that are consistent with the observations. There are certainly other more detailed models that can fit the epithermal data, but the finding of abundant water ice in the shallow subsurface of Mars is robust.
REFERENCES
1. B. M. Jakosky, R. M. Haberle, in Mars, H. H. Kieffer, B. M. Jakosky, C. W. Snyder, M. S. Matthews, Eds. (Univ. of Ariz. Press, Tucson, 1992), pp. 969–1016.
2. P. B. James, H. H. Kieffer, D. A. Paige, in Mars, H. H. Kieffer, B. M. Jakosky, C. W. Snyder, M. S. Matthews, Eds. (Univ. of Ariz. Press, Tucson, 1992), pp. 934–968.
3. R. B. Leighton, B. C. Murray, Science 153, 136 (1966). The seasonal caps consist of a minor amount of water frost, on the order of ≥20 precipitable μm (1).
4. CO2 condenses into the solid phase at a temperature of ∼148 K at the average martian surface pressure of ∼610 Pa.
5. H. H. Kieffer et al., Science 194, 1341 (1976).
6. H. H. Kieffer et al., J. Geophys. Res. 84, 8263 (1979).
7. D.A. Paige et al., J. Geophys. Res. 95, 1319 (1990).
8. Martian atmosphere consists of 95% of CO2. Column abundance of water in the martian atmosphere is on the order of 10–3 g cm–2, which is the equivalent of 10 precipitable μm. During northern summer the abundance increases to 100 μm above the cap (35).
9. S. W. Squyres, S. M. Clifford, R. O. Kuzmin, J. R. Zimbleman, F. M. Costard, in Mars, H. H. Kieffer, B. M. Jakosky, C. W. Snyder, M. S. Matthews, Eds. (Univ. of Ariz. Press, Tucson, 1992), pp. 523–554.
10. Ground ice is stable where it is in equilibrium with the water vapor content of the martian atmosphere (36).
11. M. H. Carr, Water on Mars (Oxford, New York, 1996).
12. S. M. Clifford, T. J. Parker, Icarus 154, 40 (2001).
13. D. M. Drake, W. C. Feldman, B. M. Jakosky, J. Geophys. Res. 93, 6353 (1988).
14. W. C. Feldman, W. V. Boynton, B. M. Jakosky, M. T. Mellon, J. Geophys. Res. 98, 20855 (1993).
15. J. Masarik, R. J. Reedy, J. Geophys. Res. 101, 18891 (1996).
16. W. V. Boynton et al., Space Sci. Rev., in press.
17. W. C. Feldman et al., Science 297, 75 (2002).
18. I. G. Mitrofanov et al., Science 297, 78 (2002).
19. W. V. Boynton et al., Science 297, 81 (2002).
20. It is typical to express seasonal changes on Mars with respect to solar longitude, Ls, which runs from 0° to 360°, with 0° corresponding to the vernal equinox in the northern hemisphere. Odyssey mapping stage started at 18 February 2002 (Ls = 330° before the recent vernal equinox at 18 April 2002). The HEND data are presented until 8 April 2003 (Ls = 165° after the recent equinox at 18 April 2002).
21. Epithermal neutrons have energies from 0.4 eV up to 1 MeV. These neutrons provide the most evident signature for the presence of subsurface water.
22. P. B. James, B. A. Cantor, Icarus 154, 131 (2001).
23. H. H. Kieffer et al., J. Geophys. Res. 105, 9653 (2000).
24. M. T. Zuber et al., J. Geophys. Res. 97, 7781 (1992).
25. D. E. Smith et al., J. Geophys. Res. 106, 23689 (2001).
26. MOLA is a 10-Hz laser ranging system that measures the topography of Mars (37). Before averaging, topography measurements have an accuracy of < 1 m, but with averaging the accuracy in latitudinal annuli can be improved to ∼10 cm, which is suitable to detect seasonal changes in surface height produced by the condensation and sublimation of CO2 (27). Time variations in topography from MOLA were measured during the period 28 February 1999 through 25 May 2001.
27. D. E. Smith, M. T. Zuber, G. A. Neumann, Science 294, 2141 (2001).
28. Although interannual variations in seasonal snowfall may occur at least on a regional scale (38), the global trends would be expected to correspond to the level of detectability if CO2 condensation and sublimation were primarily controlled by solar insolation (3).
29. All four layers may contribute to the layer of neutron production. Calculations of neutron emission from the layer of neutron production were performed by standard MCNPX code (39).
30. H. Wanke, J. Bruckner, G. Dreibus, R. Reider, I. Ryabchikov, Space Sci. Rev. 96, 317 (2001).
31. Measurements from the Viking-1 lander indicated that the content of bound water in the upper layer is in the range 0.1 to 3% (32). Recent Mars Odyssey in-flight calibration models (GRS, HEND, and NS data) based on 100% of H2O in north residual polar cap suggest that this value could be between 2 and 3%. In our study we assumed 3 wt % H2O in the uppermost dry layer of the subsurface, which leads to the most conservative estimate of water-ice content below it.
32. K. Biemann, J. Mol. Evol. 14, 65 (1979).
33. Neutron fluxes have been normalized to unity for the maximum flux from the Solis Planum region, the driest region of Mars and an area not affected by seasonal CO2 precipitation (Fig. 1; 270°E, 25°S). This normalization allows us to exclude the effect of temporal variations of neutron emission of Mars due to variable flux of charge particles from the Sun. To estimate absolute values of water content in different regions of Mars it is necessary to determine the amount of water in this reference region. Numerical calculations show that the best agreement between neutron measurements and a regolith model with a soil with Pathfinder composition (30) and free parameter of water content corresponds to 1.5 to 2 wt % H2O. To establish a conservative lower-limit estimation for water content in other regions of Mars, we have accepted 1.5% for the reference value for the Solis Planum region.
34. For an average soil density of 1.6 g/cm3, the column density of 10 g/cm2 for 80° to 85°N corresponds to 6-cm thickness of upper drier layer, the column density of 40 g/cm2 for 70° to 79°N corresponds to the linear thickness of 25 cm, and the column density of 60 g/cm2 for 65° to 69°N implies 37 cm of drier soil above the water ice–rich ground.
35. B. M. Jakosky, C. B. Farmer, J. Geophys. Res. 87, 2999 (1982).
36. C. B. Farmer, P. E. Doms, J. Geophys. Res. 84, 2881 (1979).
37. D. E. Smith et al., Science 284, 1495 (1999).
38. M. C. Malin, K. S. Edgett. J. Geophys. Res. 106, 23429 (2001).
39. L. S. Waters, Ed., MCNPX User's Guide (document LA-UR-99-6058, Los Alamos National Laboratory, Los Alamos, NM, 1999).
40. Because HEND has a wide field of view, the signal in each pixel represents the superposition of many nearby pixels. The horizontal resolution is about 300 km.
41. We acknowledge the Mars Odyssey and Mars Global Surveyor spacecraft and operation teams at the Jet Propulsion Laboratory and Lockheed-Martin Astronautics. The HEND and MOLA investigations are supported by NASA's Mars Exploration and Data Analysis Programs. M.T.Z. acknowledges support from a fellowship from the Radcliffe Institute for Advanced Study at Harvard.
