")
")
Seasonal Carbon Dioxide Depositions on the Martian Surface as Revealed from Neutron Measurements by the HEND Instrument Onboard the 2001 Mars Odyssey Spacecraft
M.L.Litvak1, I.G.Mitrofanov1, A.S.Kozyrev1, A.B.Sanin1, V.I.Tret'yakov1, W.V.Boynton2, C.Shinohara2, D.Hamara2, R.S.Saunders3 and D. M. Drake4
1 Space Research Institute, Russian Academy of Sciences, Profsoyuznaya ul. 84/32, GSP-7, Moscow, 117810 Russia
2 Lunar and Planetary Laboratory, University of Arizona, Tucson, AZ 85721, USA
3 NASA Headquarters, Washington, DC 20514, USA
4TechSource, Santa Fe, NM 87505, USA
Abstract - We present the results of eighteen months of observations of the seasonal caps of Mars based on data from the neutron spectroscopy of the surface by the Russian HEND Instrument mounted aboard the NASA 2001 Mars Odyssey spacecraft. A four-dimensional model of the Martian seasonal caps was developed on the basis of these observation data. The model shows how the thickness of the frozen carbon dioxide changes in different surface regions. Using the results of the model, we estimated the total mass of the seasonal caps for the period of maximal accumulation of seasonal depositions and the rates of condensation and sublimation of the seasonal cover.
DOI: 10.1023/B:SOLS.0000030856.83622.17 - http://www.springerlink.com/content/uw02316n8469xm85/
-------------------------------------------------------------------------------------------------------------------------------------------------
NEUTRON SPECTROSCOPY OF THE MARTIAN SURFACE
CALCULATION OF THE NEUTRON FLUX AT THE MARTIAN SURFACE FROM MEASUREMENTS
MADE FROM ORBIT
THE THICKNESS OF THE SEASONAL CARBON DIOXIDE COVER ON MARS
MEASURING THE MASS OF THE MARTIAN SEASONAL CAP
THE RATES OF SUBLIMATION OF THE SNOW COVER IN THE NORTH AND
ITS CONDENSATION IN THE SOUTHS
The alternation of seasons on Mars is accompanied by a redistribution of the atmospheric carbon dioxide between the planetary poles. This process is a global one and affects about 25% of the entire atmospheric mass (Leighton, 1966; Tillman et al., 1993). In autumn a moment comes in each hemisphere when the temperature falls below the freezing point of carbon dioxide. After this the carbon dioxide, which makes up about 95% of the Martian atmosphere, starts to condense on the planetary surface. The carbon dioxide condensation continues for the whole autumn and stops in late winter, forming a seasonal polar cap. The seasonal CO2 cover starts to evaporate from the beginning of spring and completely disappears by the beginning of summer, uncovering the residual polar caps. The north residual polar cap is assumed to consist of pure water ice (Kieffer et al., 1976). In the south the summer is colder than in the north, and the dry ice is not completely sublimated into the atmosphere. That is why the south residual polar cap is covered with a carbon dioxide layer all year round (Kieffer et al., 1979; Paige et al., 1990).
The seasonal depositions of the atmospheric carbon dioxide cover enormous areas of the planet's surface, extending to the 60th parallel in the northern hemisphere and to the 50th parallel in the southern one. According to the data from the laser altimeter (MOLA) onboard the Mars Global Surveyor spacecraft, the thickness of the dry ice cover varies from several centimeters at the boundaries of the polar caps to 1–1.5 m closer to the Martian poles (Smith et al., 2001). The north and south seasonal carbon dioxide depositions are not similar, because they are formed under different climatic conditions. The southern near-polar regions of Mars are higher than the northern ones; thus, the atmospheric pressure is considerably lower in the south than in the north. In addition, we should take into account that Mars rotates around the Sun in an elliptic orbit. This also leads to differences between the same seasons in the northern and southern hemispheres.
Global climate models were developed in the 1990s, based on available observational data. The climate models described seasonal variations on Mars and predicted the behavior of the Martian seasonal caps (Haberle et al., 1993; Forget et al., 1998). Despite plenty of experimental data and a great number of theoretical studies, the accuracy of determining the total mass of the polar caps and the time profile of the seasonal carbon dioxide depositions on different parts of the surface is still poor. The seasonal variations of the boundaries of the seasonal caps are well known, owing to permanent monitoring of the surface in the visible and infrared regions. However, such parameters as the mass, density, thickness of the seasonal deposit, and rates of sublimation and condensation are model-dependent. Not only large measurement errors, but also uncertainties in the use of different atmospheric models affect the accuracy of their determination.
One of the best estimates of the mass, thickness, and density of the carbon dioxide seasonal deposit was obtained from the combined analysis of the data from the MOLA experiment and the data describing the changes of the spacecraft trajectory due to the redistribution of the mass of the seasonal depositions, which was obtained during the NASA Mars Surveyor mission. The laser altimeter (MOLA) allowed direct measurements of the thickness of the seasonal deposit with an accuracy of up to 20 cm. High-precision measurements of the orbital parameters give us a chance for rough estimations of the total mass of the seasonal caps and the density of the seasonal CO2 depositions.
After the 2001 Mars Odyssey orbiter had been launched into its orbit, the possibility appeared of measuring the masses of the seasonal caps and the rates of carbon dioxide sublimation and condensation quite accurately. This possibility is primarily connected with the gamma ray spectrometer (GRS) instrument suite (Boynton et al., 2003), which was the first to provide information on detailed mapping of the gamma radiation and neutron albedo from the surface of Mars. This GRS suite consists of the American gamma-spectrometer (GRS), the neutron spectrometer (NS), and the Russian HEND instrument. The gamma spectrometer was created on the basis of high-purity germanium, and its main task is to search for nuclear lines in the spectrum of gamma radiation coming from the surface of the planet. The NS and HEND instruments provide a mapping of the neutron radiation from Mars in a wide range of energies. The Russian HEND instrument measures epithermal, fast neutrons, and high-energy neutrons; the NS neutron spectrometer records thermal, epithermal, and fast neutrons.
The analysis of the data obtained in the HEND experiment during the first year of flight in orbit around Mars demonstrated that the neutron fluxes, arising in the near-polar regions of Mars, vary by a factor of 2–3 due to seasonal variations on Mars (Litvak et al., 2003). These observations can be used to quantitatively estimate the parameters characterizing the seasonal caps of Mars. The present paper is dedicated to an analysis of seasonal variations of the neutron data and to the development of a dynamical model of seasonal depositions for different regions in the northern and southern hemispheres of Mars.
NEUTRON SPECTROSCOPY OF THE MARTIAN SURFACE
Estimation of soil water content from neutron measurements. The neutron radiation of Mars arose under bombardment of the planet's surface by galactic cosmic rays. Cosmic-ray particles can freely penetrate through the thin Martian atmosphere to the planetary surface and, by interacting with nuclei of the rockforming elements, produce fluxes of fast neutrons at a depth of several meters with energies of 15–20 MeV (Drake et al., 1988; Feldman et al., 1993). In their turn, when the fast neutrons move to the surface, they undergo elastic and inelastic collisions and are even captured by nuclei of chemical elements composing the Martian soil. The inelastic collisions and capture reactions result in an emission of nuclear gamma lines. The nuclear composition of the soil can be determined from analyzing the spectral distribution of these lines, as each nucleus emits photons with definite energies (Masarik et al., 1996).
The efficiency of the moderation of the fast neutrons in the subsurface layer of the planet depends on the presence of hydrogen atoms in the soil. Even if hydrogen composes only 1% of the soil mass, the efficiency of the neutron moderation increases and the outgoing flux of fast neutrons respectively decreases by approximately 10% (Drake et al., 1988). In principle, in the Martian soil, hydrogen can be a part of different chemical compositions, including, for example, water or various clays. The presence of hydrogen in the surface soil layer can be most probably explained by associating it with different forms of water, for example, adsorbed, chemically bound water, or even ice (Soderblom, 1992; Mohlmann, 2002; Basilevsky et al., 2003; Kuzmin et al., 2004). Thus, neutron spectroscopy from a near-Mars orbit is one of the most sensitive methods for searchingfor water in the subsurface layer of Martian soil.
The neutron mapping of the planet's surface revealed considerable variations in the neutron flux for different regions of Mars (Feldman et al., 2002; Mitrofanov et al., 2002, 2003c). In addition, it was found that the neutron emission from high-latitude zones undergoes considerable seasonal variations. Based on an analysis of the results of the neutron measurements and some other observation data, it was demonstrated (Feldman et al., 2003; Litvak et al., 2003a, 2003b, 2003c) that the seasonal variations of the high-latitude flux are associated with a change of the composition of the subsurface layer due to seasonal carbon dioxide depositions. Actually, two different directions of the Mars investigation were formed based on the analysis of neutron data.
Examination of the surface without seasonal carbon dioxide deposits. The first direction includes examination of the surface free of carbon dioxide. It is based on the data of continuous observations of low-latitude regions and on the data of measurements at high latitudes during summer. These studies allow one to find the global water distribution in the subsurface layer of Mars and the mineralogical composition of this layer. The purpose of the second direction of studies is the investigation of the dynamics of seasonal carbon dioxide depositions based on observations of variations of the neutron flux at high latitudes.
The result of the studies in the first direction is the conclusion that the Martian surface at high-latitudes is characterized by a considerably lowered neutron emission, which is about 0.1 of the flux measured in the equatorial regions of Mars, such as Solis Planum and Argyre Planitia (Mitrofanov et al., 2002; Feldman et al., 2002; Mitrofanov et al., 2003c). Examination of these results demonstrated that the observed effect can be explained by the presence of a large amount of water ice in the near-polar regions (Mitrofanov et al., 2002; Feldman et al., 2002; Mitrofanov et al., 2003c). It was also shown that the data of neutron measurements and measurements in the 2.2 MeV emission line of deuterium can be explained by the assumption that a soil layer with a very high water ice content is present at a depth of about several tens of centimeters and extends from the poles to the 50–60th parallel in the north and in the south (Boynton et al., 2002).
Examination of seasonal variations of the neutron flux. The presence of a large amount of water plays a crucial role in making the neutron spectroscopy of the near-polar surface regions during a Martian year an effective tool for examining the dynamics of mass variations of the seasonal carbon dioxide depositions. During the polar summer we observe the surface free of the seasonal CO2 cover. A significant moderation of the flux of fast neutrons at this time of the year is determined by the water-rich soil composition. The moderation is most efficient during this time. The maximal depth at which neutrons are generated does not exceed 1–2 m for epithermal neutrons and several tens of centimeters for fast neutrons with energies above 1 MeV. In autumn and winter, a layer of "dry carbon dioxide ice" is condensed on the surface; it protects the lower soil layers, which are rich in water ice, from cosmic rays. Even for the CO2 deposits with a thickness of several centimeters, the effective layer, where neutrons are generated, moves upward, partially including the uppermost carbon dioxide layer. Because CO2 molecules do not moderate high-energy neutrons as efficiently as hydrogen atoms do, the flux of epithermal and fast neutrons increases considerably compared to the summer observations. The thicker the snow cover, the higher the effective layer of neutron production. This results in an increase of the flux of fast and epithermal neutrons. Finally, a situation can occur when the thickness of the frozen carbon dioxide is so large that the neutron flux from the surface is completely determined by the nuclear composition of carbon dioxide. In this case, saturation takes place and the neutron flux does not increase any more with further thickening of the carbon dioxide cover.
Neutron observations under saturation conditions can be used for an absolute calibration of the neutron data, proceeding from the fact that all measured neutrons are generated in the CO2 layer with a given nuclear composition. For the regions that are not at saturation conditions, the 10 eV–1 MeV neutron flux grows monotonically with an increase of the thickness of precipitated atmospheric carbon dioxide and can be used to measure this thickness. The neutron flux stops growing only at the end of the polar winter, when the process of the seasonal cap formation is over. At the beginning of the polar spring, the temperature increases, and the precipitated carbon dioxide starts its sublimation back into the Martian atmosphere. A decrease in the thickness of the seasonal deposit leads to the displacement of the effective layer of production of high-energy neutrons down to the upper soil layers with a high water ice content. Because of this, the flux of epithermal and fast neutrons decreases and the process continues in this way until the seasonal deposit is completely evaporated.
In order to develop the model of seasonal circulation of carbon dioxide between the atmosphere and the seasonal caps, long-term observations during several Martian years are necessary. The basic parameters of this model can be found, only now, from the data of neutron measurements performed during 18 months of the orbital flight. The current results allow one to study the process of formation of the south seasonal cap of Mars, to estimate its total mass and the rate of condensation of the atmospheric carbon dioxide on the surface of the southern near-polar regions. The accumulated data also contain enough information to estimate the total mass of the north seasonal cap and to examine the reduction of its mass resulting from the sublimation of the seasonal deposit back into the atmosphere during the northern spring. The present study is dedicated to the investigation of these questions.
CALCULATION OF THE NEUTRON FLUX AT THE MARTIAN SURFACE FROM MEASUREMENTS MADE FROM ORBIT
The selection of the model describing the production and transfer of neutrons in the Martian surface. To use the measured neutron flux from Mars for estimation of the thickness of the carbon dioxide layer on the surface, a model should be developed that takes into account all the factors responsible for the production of neutrons and for their scattering along the path from the point of their production over the planet's surface to the detector device. The simplest model includes the Martian atmosphere, the seasonal carbon dioxide deposit, and the Martian soil. Although the thickness of the Martian soil, observed during the neutron mapping of the surface, does not exceed 1–2 m, it cannot always be considered homogeneous. It was shown by Boynton et al.(2002), Feldman et al. (2002), and Mitrofanov et al. (2002, 2003c) that in the southern near-polar regions of the planet the soil can be described using a two-layer model. According to this model, an infinite lower layer with a high water content of about several tens of percent (by mass) is covered by an upper relatively dry layer with a water content of not more than 2–5% by mass. The thickness of this upper layer varies from several centimeters to a meter with increasing distance from the poles.
The two simplest soil models, the one-layer and the two-layer one, should be considered in the general case (see Mitrofanov et al., 2003b). The observational data should first be analyzed using the one-layer model, as it describes the simplest case of the soil composition. If this model agrees with the observations, there is no reason for applying more complicated models provided that there is no independent a priori information about the need for such models. If the one-layer model is rejected by the observation data, it is necessary to pass to the two-layer model and to test its agreement with the observations.
A lot of free parameters must be introduced in order to describe a soil model. Among these parameters are elemental abundances, the amount of water in the lower layer, the amount of water in the upper layer, the thickness of the upper layer, and, finally, the chemical composition of the rocks covering the surface of Mars. We cannot uniquely estimate all these parameters from the neutron data. Only two parameters were used as free ones:
(1) the amount of water in the semi-infinite soil layer for the one-layer model or in the lower layer for the two-layer model;
(2) the thickness of the upper, relatively dry soil layer in the two-layer model.
The values of the other parameters were fixed. Thus, the soil chemical composition corresponded to the results of the measurements made by the APXS instrument mounted on the Sojoiner Rover of the Mars Pathfinder lander (Rieder et al., 1997) and was based on the data averaged over all the sets of measurements, including not only the soil but also the stones. The water content in the upper layer of the two-layer model was fixed at a level of 2% by mass. This value corresponds to the estimates of the water amount obtained in the APXS experiment (Economou et al., 2003). It also agrees with the calibration measurements of neutrons and gammarays from the equatorial regions around Solis Planum and with the results of Boynton et al. (2003) and Feldman et al. (2003).
Consideration the variable thickness of the Martian atmosphere. It is known that the thickness of the Martian atmosphere varies from 5 to 25 g/cm2. Calculations show that this thickness is sufficient to considerably affect the formation of the neutron flux at the orbit. Because the thickness of the atmosphere varies from point to point and also undergoes seasonal variations, the calculations were performed individually for each chosen geographic region and seasonal interval. The effective atmospheric thickness (g/cm2 ) in each particular case was taken from the predictions of the global climate model developed at the NASA AMES Research center (Haberle et al., 1993).
Large-domain approximation in processing of the orbital measurement data. The typical time of one measurement at a near-Mars orbit is about 20 s. The spacecraft, on average, flies a little more than one degree of the major arc during this time. However, the spot on the Martian surface from which the recorded neutrons are really collected is determined by the collimation of the neutron flux in the atmosphere and, thus, has a much larger size. The calculations show that the spot can be 10°×10° or 600×600 km in size. Generally speaking, the model-dependent approach applied to the data processing allows one to distribute the recorded neutrons with different probability within this spot. However, this method requires consideration of many factors, depends on the choice of the model, and needs much CPU time for data processing. This procedure is under verification now. A "large-domain" approximation seems adequate for the purposes of this study. The northern and southern regions of Mars are partitioned into large regions; they are greater in size than footprint.
The application of such an approximation to the northern hemisphere corresponds to partitioning it into 74 equal-sized regions, which completely (with overlapping) cover the Martian surface higher than 60°N. For the southern hemisphere we used 98 regions of equal area covering the surface of Mars higher than 50°S. This choice completely includes all the regions where seasonal variations were found in the neutron measurements (Fig. 1).
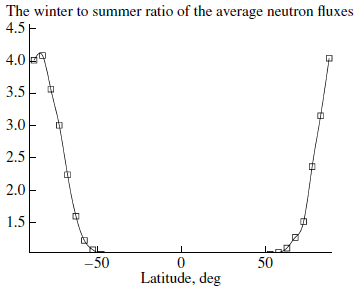
Fig. 1. The ratio of the average neutron fluxes measured during the polar winter and the polar summer in different latitudinal belts.
Estimation of the variableness of the cosmic-ray flux. The production of neutrons in the subsurface layer of Mars depends on the flux of cosmic rays, which changes with time. This is caused mainly by an increase in solar activity, when the flux of cosmic rays can change by several times. When seasonal variations of the neutron flux are examined, the cosmic-ray variations can make it difficult to interpret the experimental data unambiguously. To eliminate such errors, we estimated the flux of cosmic rays for different time intervals. For this purpose we used the neutron data obtained in the region of Solis Planum. This is the driest region of Mars located near the equator. The possible variations of the neutron flux in this region at different time moments are not associated with hydrologic activity or seasonal variations, but are determined by variations of the cosmic-ray flux. The subsurface layer in this region can be described by the one-layer soil model with an element composition corresponding to the Mars Pathfinder measurements and a water amount at a level of 2% by mass.
All the measurements in the Solis Planum region were partitioned into seasonal intervals. An additional layer was then added to the one-layer soil model. This layer mimics the atmosphere for the fixed seasonal interval in accordance with the global climate model. The neutron flux at the orbit over this region was estimated by means of numerical modeling. The cosmicray flux was a free parameter in this case. By varying the cosmic-ray flux, we could achieve better agreement between the modeled neutron flux and the experimental data. The application of such a technique allowed us to estimate the flux of cosmic rays for all chosen seasonal intervals. This estimate was used for processing the data of neutron measurements from the selected nearpolar regions in the northern and southern hemispheres.
The procedure for estimating the variable thickness of the carbon dioxide deposit from the neutron measurement data. Taking into account the aforementioned, we can formulate a procedure for processing the data from the orbital neutron observations, which allows an estimation of the thickness of the carbon dioxide deposit to be performed for each of the 74 and 98 near-polar regions for each selected seasonal interval. This processing was done in two steps. First, the parameters of the near-polar regions were estimated for a frost free surface (there were no carbon dioxide depositions). As a result of this step, we estimated the subsurface soil parameters for the one-layer and two-layer approximations for each of the 172 near-polar regions. The data for the seasonal intervals within Ls= 120°–150° were used, at the first step, for the 74 regions of the northern hemisphere. For the 98 regions of the southern hemisphere we used, at the first step, the data for the seasonal intervals within Ls= 330°–360°. Using the data of independent measurements and the results of the measurements by the HEND instrument, we found that the Martian surface was free of the seasonal carbon dioxide deposit during the indicated seasonal intervals.
At the second step, we processed observations for each of the 172 regions for the seasons when the surface of these regions was covered by carbon dioxide. The parameters of the soil composition determined at the first step were fixed in this case, and the only free parameter was the thickness of the CO2 condensation layer. In all the cases considered, we managed to obtain good agreement between the measurement data and the model predictions, and the "best fit" conditions were used to estimate the thickness of the seasonal layer for the region in view during the given seasonal interval.
THE THICKNESS OF THE SEASONAL CARBON DIOXIDE COVER ON MARS
The thickness of the seasonal deposit in different surface regions. In this section we shall present the results of measuring the effective thickness of the atmospheric carbon dioxide depositions for each selected region. Figure 2 shows how the thickness of the seasonal CO2 cover in different regions varies with time as the northern spring comes. Figure 2a demonstrates the thickness of the seasonal deposit as a function of latitude. A few latitudinal dependencies, plotted for different seasonal intervals, are presented here. It can be easily seen that the effective thickness increases when approaching the north pole of Mars, where the climatic conditions are favorable for the most abundant atmospheric precipitation. This dependence is most clearly exemplified by the curve plotted for the early spring, when the thickness of the seasonal cover was maximal. Figure 2b illustrates the time dependence of the thickness of the seasonal cover. The curves shown in this figure correspond to different latitude belts. It is worth noticing that the thickness of the seasonal cover at different latitudes reaches its maximum at different times. The tendency towards a further accumulation of carbon dioxide is still noticeable at the near-polar latitudes during the time intervals when the process of sublimation has already begun at low latitudes. Generally, we can say that the peak in the seasonal cover accumulation is observed in early spring in the range Ls = 0°–15°. When the latitude varies within one and the same latitude belt, the effective thickness of the seasonal cover changes in a chaotic manner. However, taking into account the measurement errors, we can hold that the snow thickness does not depend on longitude. This can be explained by the occurrence of approximately the same climatic conditions within the same latitudinal belt.
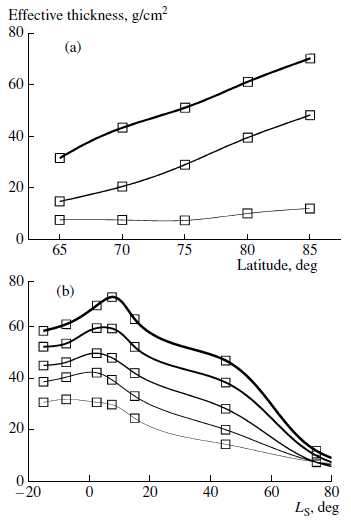
Fig. 2. The effective thickness of the seasonal deposit in the northern hemisphere as a function of the latitude of the point and time. (a) The curves of different thicknesses correspond to several seasons in the northern hemisphere. The thickest curve corresponds to the season with Ls = 0°–5°; the curve of medium thickness corresponds to the season with Ls = 30°–60°; the thinnest curve is plotted for the season with Ls = 60°–90°. (b) The curves of different thicknesses show the effective thickness of the seasonal deposit as a function of time for different latitude belts. The thicker the curve, the higher the latitude of the point. In total, five latitude belts are presented in the plot: 62.5° N–67.5° N, 67.5° N–72.5° N, 72.5° N–77.5° N, 77.5° N–82.5° N, and 82.5° N–87.5° N.
Knowing the density of the seasonal depositions ρ, we can estimate the geometric thickness, which is measured in centimeters, by the formula h = ξ/ρ, where ξ is the effective thickness in g/cm2, presented in Figs. 2 and 3. We can adopt ρ = 0.9 g/cm3 as an estimate of the density. This result was obtained in the MOLA experiment onboard Mars Global Surveyor (Smith et al., 2001). Under this assumption, the maximal thickness of the seasonal depositions observed around the north pole can reach 90 cm.
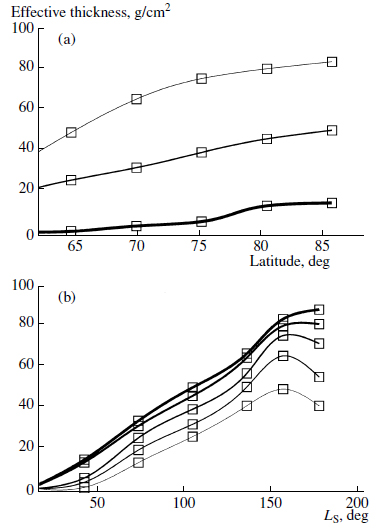
Fig. 3. The effective thickness of the seasonal deposit in the southern hemisphere as a function of the latitude of the point and time. (a) The curves of different thicknesses correspond to several seasons in the southern hemisphere. The thickest curve corresponds to the season with Ls = 30°–60°; the curve of medium thickness corresponds to the season with Ls = 90°–120°; the thinnest curve is plotted for the season with Ls = 150°–160°. (b) The curves of different thicknesses show the effective thickness of the seasonal deposit as a function of time for different latitude belts. The thicker the curve, the higher the latitude of the point. In total, five latitude belts are presented in the plot: 62.5° S–67.5° S, 67.5° S–72.5° S, 72.5° S–77.5° S, 77.5° S–82.5° S, and 82.5° S–87.5° S.
The results of measuring the thickness of the seasonal deposit in the southern hemisphere are presented in Fig. 3. Figure 3a, like Fig. 2, gives the thickness of the seasonal depositions versus the latitude of the point. In contrast to the observations of the northern hemisphere, the abrupt transition from small thicknesses at low latitudes to large values in the near-polar belts is not observed here. In the south, the thickness of the seasonal deposit grows smoother with an increase of latitude. In addition, the seasonal deposit is formed at lower latitudes in the south (see also Fig. 1). This is supported by observations made by different instruments for both the current Martian year and previous seasons. Figure 3b demonstrates the effective thickness of the seasonal deposit as a function of time. This plot illustrates how the thickness of the south seasonal cap changed during the southern autumn and winter. It can be seen from the figure that the snow depth stopped increasing at the end of the southern winter, when the Ls values were within the 150°–180° range. During the later time intervals, sublimation of the seasonal deposit back into the atmosphere already dominates. The processes of condensation and sublimation of the seasonal cover do not proceed in a similar way at different latitudes. The peak of accumulation of the seasonal depositions for the intermediate polar latitudes occurs in the interval with Ls = 150°–160°, after which sublimation of the seasonal cover begins. This moment comes considerably later for the near-polar regions, approximately in the interval Ls = 170°–180°.
Using the estimated density of the seasonal CO2 deposit (see the beginning of the section), we can estimate the maximal thickness of the seasonal deposit in south seasonal cap. The observational data show that this value can be as high as 1 m. It follows from the esults obtained that the maximal thickness of the north seasonal cap is smaller than that of the south one. This fact can be explained by two causes. First, the calculations were performed for wide latitude zones, which were within the 80°–90° N and 80°–90° S intervals for the northern and southern hemispheres, respectively. They were much greater than the local polar regions, where the maximal values were observed. Thus, the thicknesses obtained are the result of averaging over a large area. Second, the saturation of the neutron flux (see the first section), when the neutron measurements become nearly insensitive to further increase of the thickness of the seasonal cover, begins to take affect at such thicknesses. The values obtained for the north and south seasonal caps should be considered to be a lower estimate for the maximal thickness of the seasonal deposit.
No saturation of the neutron flux occurs at the intermediate and peripheral latitudes of the Martian seasonal caps (lower than 80°). The thicknesses of the seasonal deposit found in these regions can be compared to the results of other experiments. For example, a comparison of the results of neutron measurements of the Martian surface with the direct measurements of the snow thickness performed by the laser altimeter onboard the Mars Global Surveyor spacecraft demonstrated a high correlation between the two types of data (Mitrofanov et al., 2003a; Litvak et al., 2003c). Although the data of the two experiments were obtained in different Martian years, the thicknesses of the seasonal deposit estimated from the data of different types are close to each other.
The four-dimensional model of the carbon dioxide seasonal cover. We developed a four-dimensional model of the carbon dioxide seasonal cover based on the set of calculations for the 172 near-polar regions of Mars for 14 time winter intervals in the north and in the south. This model makes it possible to examine how the effective thickness of the seasonal CO2 deposit varies from point to point and with time. The mass of the seasonal caps and the rates of condensation and sublimation of the seasonal cover can be estimated from this model. This will be considered in more detail in the next section.
MEASURING THE MASS OF THE MARTIAN SEASONAL CAPS
Neutron measurements depend on the column density or the effective thickness of the medium, which is measured in g/cm2. It is not enough to have only the HEND data if we want to determine the geometric thickness of the seasonal deposit. The average density of the seasonal depositions is necessary to perform such estimates. However, this deficiency can be turned to our advantage if we set the task of measuring the mass of the seasonal caps. The mass of the seasonal deposit m on a region with an area S is equal to the product ρhS, where ρ is the density of the seasonal deposit, and h is its average thickness. This simple formula can be presented in the form m = ξS, where ξ is the column density or the effective thickness of the seasonal deposit obtained from neutron measurements. Thus, the fourdimensional seasonal deposit model presented in the previous section can be used to study variations of the total mass of the seasonal caps during the entire Martian cycle.
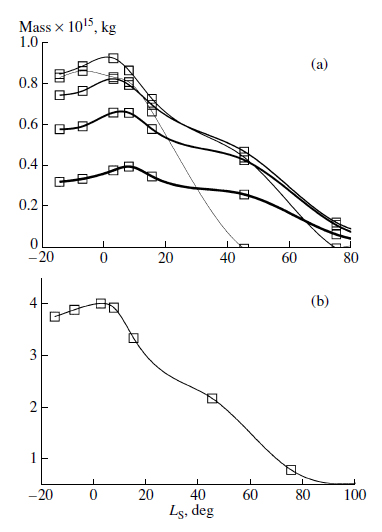
Fig. 4. The mass of seasonal depositions in the northern hemisphere versus time. In (a) the lines of different thickness show the time dependencies of the mass of the seasonal deposit for different latitude belts. The thicker the curve, the higher the latitude of the point. In total, five latitude belts are presented in the plot: 62.5° N–67.5° N, 67.5° N–72.5° N, 72.5° N–77.5° N, 77.5° N–82.5° N, and 82.5° N–87.5° N. In (b) the total mass of the north seasonal cap of Mars is given as a function of time.
Figure 4a presents the curves showing how the mass of the seasonal deposit changes with time at different latitudes of the northern hemisphere. The data presented here allow one to see the peak of the total accumulation followed by the reduction of the mass of the seasonal deposit caused by the approach of northern spring and the start of the sublimation of the frozen carbon dioxide back into the atmosphere. Because the variations of the effective snow thickness are determined by the latitude of the point (see the previous section and Fig. 2), the peak of accumulation of the total mass of the seasonal depositions at a given latitude shifts to later times with an increase in latitude. A comparison of the curves plotted for different latitudes show that the intermediate latitudes contribute the main deposit into the total mass of the seasonal cap. The small thickness of the seasonal deposit at these latitudes (as compared to the polar regions) is amply compensated for by the much greater surface area. Even the boundary latitudes of about 60°–65° N fundamentally contribute to the mass of the seasonal cap, because of the large area over which the seasonal depositions are distributed.
Figure 4b combines all the measurements and shows the time behavior of the total mass of the north seasonal cap. It can be seen in the figure that the maximum of the seasonal deposit accumulation in the north of Mars occurs during the time interval corresponding to Ls = 0°–15°. The total mass of the north seasonal cap of Mars is equal to approximately 4.0 × 10¹⁵ kg at this moment. This value is close to the results obtained by the team of the MOLA experiment, onboard the Mars Global Surveyor spacecraft. The mass of the north seasonal cap was estimated in this study as 3.1 × 10¹⁵ kg (Smith et al., 2001). In addition, the results obtained from the HEND data also agree with the predictions of the modified global climate model of Mars. This model gives an estimate of about 4 × 10¹⁵ kg for the total mass of the north seasonal cap (Smith et al., 2003).
The results of the similar analysis for the south seasonal cap of Mars are given in Fig. 5. As in the north, the latitude dependence of the accumulation of the total mass of the seasonal deposit can be retraced at different latitudes (Fig. 5a). It is also seen from Fig. 5 that the latitude variations of the mass of the seasonal deposit in the south seasonal cap are smoother than those in the north one. That is why the contribution of the intermediate and peripheral latitudes to the total mass of the south seasonal cap becomes more valuable than in the northern hemisphere. It must also be taken into account that the south seasonal cap is greater in size than the north cap. Its lower boundary is shifted towards low latitudes, lower than the 60th parallel, and it covers the 50°–60° S latitude belt (see Fig. 1). Taking into account that the surface area increases as a cosine of the latitude with increasing distance from the pole, we can say that the seasonal depositions cover a considerably larger area in the south than in the north. The smooth change in the thickness of the seasonal deposit with decreasing latitude and the large size of the south seasonal cap result in the larger mass of the south seasonal cap in comparison with the north one. This can be seen well in Fig. 5b, where the variations of the total mass of the south seasonal cap are shown. The maximal accumulation of the total mass of the south seasonal cap occurred during the time period with Ls = 150°–160°. The total mass of the south cap reached 6.3 × 10¹⁵ kg at this moment. This estimate also agrees with the predictions of the global climate model (~6 × 10¹⁵ kg, see, e.g., Smith et al., 2003). However, it should be noted that Smith et al. (2001) gave a much lower estimate of the mass of the south seasonal cap, 3.6 × 10¹⁵ kg, based on an analysis of the trajectory data of the Mars Global Surveyor spacecraft. Such a difference in the estimations can be explained by both the high observation errors and the limitations of the simplified model describing gravitational disturbances on Mars, which was applied by the authors of this study. A number of papers considering the measurements of the total mass of the seasonal caps of Mars based on variations of the Martian gravitational field demonstrated that the spread of the values can be considerably high for different models (Yoder et al., 2003; Karatekin et al., 2003).
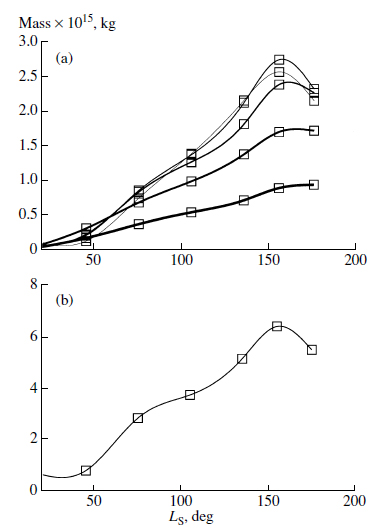
Fig. 5. The mass of seasonal depositions in the southern hemisphere versus time. In (a) the lines of different thickness show the time dependencies of the mass of the seasonal deposit for different latitude belts. The thicker the curve, the higher the latitude of the point. In total, five latitude belts are presented in the plot: 62.5° S–67.5° S, 67.5° S–72.5° S, 72.5° S–77.5° S, 77.5° S–82.5° S, and 82.5° S–87.5° S. In (b) the total mass of the north seasonal cap of Mars is given as a function of time.
THE RATES OF SUBLIMATION OF THE SNOW COVER IN THE NORTH AND ITS CONDENSATION IN THE SOUTH
The curves of the time variations of the total mass of the Martian seasonal caps obtained above allowed us to estimate the rates of sublimation and condensation of the seasonal deposit. A large amount of measurement data were accumulated for the northern hemisphere for the spring–summer period, when the north seasonal cap actively sublimates into the Martian atmosphere. Using the curve presented in Fig.4a, we can construct a dependence showing how the rate of sublimation of the seasonal deposit varied during this time of the year. To do this, it is sufficient to find a derivative at each point of the curve. The result of the differentiation is presented in Fig. 6. Looking at the behavior of the curve in this figure, we can say that the rate of sublimation changed considerably with time and had several local maxima. The main maximum was observed in the Ls = 15° region, when the process of sublimation of the frozen carbon dioxide affected all the latitude belts. At this moment the sublimation rate was about 50 kg km–2 s–1. The second peak has a smoother shape and falls in the time interval near Ls = 60°.
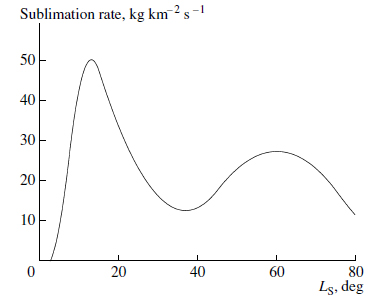
Fig. 6. The rate of sublimation of the north seasonal cap as a function of time.
In contrast, the bulk of data for the southern hemisphere was obtained during the southern autumn and winter. This allowed us to estimate the rate of condensation of the atmospheric carbon dioxide in the southern regions. By differentiating the curve presented in Fig. 5a, we can get a dependence describing the rate of condensation of the atmospheric carbon dioxide in the southern regions of Mars. The constructed curve has an irregular shape with a primary maximum at about Ls = 140° (see Fig. 7). The condensation rate is about 30 kg km–2 s–1 at this time.
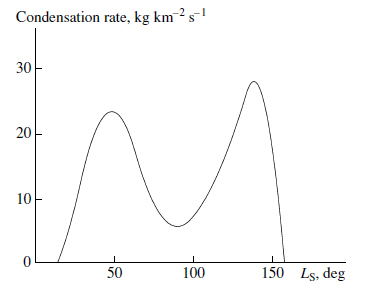
Fig. 7. The rate of condensation of the south seasonal cap as a function of time.
To make a more accurate comparison of the rates of condensation and sublimation in the northern and southern hemispheres, further observations and additional laborious calculations for different time intervals are necessary. Nevertheless, we can suggest right now that the maximal rate of sublimation in the north can be half as much again as the maximal rate of condensation in the south.
In this article we present an analysis of the data from the neutron spectroscopy of the Martian surface, obtained in the HEND experiment onboard the American orbiter 2001 Mars Odyssey during the period from February 18, 2002, to September 1, 2003. This period covers about one and a half years, its length is close to the entire Martian year. A large body of data is available, and this allowed us to examine the seasonal variations during one Martian cycle. The most complete information was obtained for the northern spring and summer, when the active sublimation of the north seasonal cap of Mars into the atmosphere took place. At the same time, the inverse process, associated with precipitation of the seasonal carbon dioxide onto the planetary surface, was proceeding in the southern hemisphere. Thus, we have data at our disposal that allow a detailed study of the process of sublimation of the seasonal deposit in the north and its condensation in the south.
The orbital fluxes of neutrons strongly depend on the thickness of the seasonal deposit. This makes them an independent tool for measuring the effective thickness and mass of the seasonal deposit at different latitudes at various time moments. To determine the thickness of the seasonal deposit, the seasonal caps of Mars were partitioned into a set of separate regions, which fully covered the entire surface. A numerical soil model was constructed for each region. The calculation of the effective thickness of the seasonal deposit was based on adding a layer, imitating the precipitated carbon dioxide, into the model. The thickness of the seasonal deposit was determined as the value providing the best agreement between the model predictions performed involving the layer of frozen carbon dioxide of a definite thickness and the experimental measurements of the orbital neutron flux during the time when the seasonal depositions were actively sublimated or condensed. A set of estimated thicknesses of the seasonal layer, obtained for each region for different time periods, allowed construction of a four-dimensional model of the seasonal deposit, which showed how the effective thickness of the frozen carbon dioxide changes from point to point and with time.
Knowing the average density of the seasonal deposit, we can convert the effective thickness, measured in g/cm2, to geometric dimensions, measured in centimeters. At a density of the seasonal deposit of about 0.9 g/cm3, the maximal thicknesses of the north and south seasonal caps oscillate about 1m. This result is an underestimation. On the one hand, the values obtained are averaged over a large area, which is deliberately greater than the area of the residual polar caps, where the maximal thickness of the seasonal deposit is observed. On the other hand, at such thicknesses of the seasonal deposit, the saturation of the neutron flux, when its value becomes insensitive to the further increase of the thickness of the seasonal depositions, starts to dominate.
The four-dimensional model of the effective thickness of the seasonal deposit, obtained in this study, allowed us to make independent calculations of the total mass of the north and south seasonal caps of Mars and to estimate the rates of their sublimation and condensation. The analysis demonstrated that the maximal precipitation of the seasonal depositions of the atmospheric carbon dioxide occurs during the time when Ls = 0°–5°. The total mass of the north seasonal cap is about 4.0 × 10¹⁵ kg at this moment. Examination of the data obtained for the southern hemisphere of Mars demonstrated that the maximal mass of the south seasonal cap is accumulated during the time interval when Ls = 150°–160°. Its value is 6.3 × 10¹⁵ kg at this moment. The constructed time dependencies of the total mass of the seasonal deposit allowed us to estimate the rate of sublimation and condensation of the seasonal depositions. The preliminary analysis revealed that the maximal rate of sublimation in the north is higher than the maximal rate of condensation in the south by a factor of approximately 1.5.
On the whole, our analysis of the neutron measurement data demonstrated that neutron spectroscopy of the surface is an independent tool for studying the seasonal caps of Mars. It provides a possibility for estimating the effective thickness of the seasonal depositions and retracing the variations of the total mass of the seasonal caps. Further observations of the subsequent seasonal cycles, including a combined analysis of the data of different experiments, will improve the accuracy of the estimates presented here and allow for a more complete understanding of the climatic processes proceeding on Mars.
1. Basilevsky, A.T., Litvak, M.L., Mitrofanov, I.G., et al., Search for Traces of Chemically Bound Water in the Martian Surface Layer Based on HEND Measurements onboard the 2001 Mars Odyssey Spacecraft, Astron. Vestn., 2003, vol. 37, no. 5, pp. 423–434 [Sol. Syst. Res. (Engl. Tramsl.), 2003, vol. 37, no. 5, p. 387].
2. Boynton, W.V., Feldman, W.C., Squyres, S.W., et al., Distribution of Hydrogen in the Near Surface of Mars: Evidence for Subsurface Ice Deposits, Science, 2002, vol. 297, pp. 81–85.
3. Boynton, W.V., Chamberlain, M., Feldman, W.C., et al., Abundance and Distribution of Ice in the Polar Regions of Mars: More Evidence for Wet Periods in the Recent Past, 6th Int. Conf. on Mars, Pasadena, 2003, Abstract no. 3259.
4. Drake, D.M., Feldman, W.C., and Jakosky, B.M., Martian Neutron Leakage Spectra, J. Geophys. Res., 1988, vol. 93, pp. 6353–6368.
5. Economou, T.E., Foley, C.N., and Clayton, R.N., The Chemical Composition of Martian Samples—Final Results from the Pathfinder Alfa Proton X-ray Spectrometer, 6th Int. Conf. on Mars, Pasadena, 2003, Abstract no. 3155.
6. Feldman, W.C., Boynton, W.V., Jakosky, B.M., et al., Redistribution of Subsurface Neutrons Caused by Ground Ice on Mars, J. Geophys. Res., 1993, vol. 98, pp. 20855–20870.
7. Feldman, W.C., Boynton, W.V., Tokar, R.L., et al., Global Distribution of Neutrons From Mars: Results From Mars Odyssey, Science, 2002, vol. 297, pp. 75–78.
8. Feldman, W.C., Boynton, W.V., Prettyman, T.N., et al., Growth of CO2 Frost Thickness Near Chasma Borealis during Northern Winter and Spring, LPSC XXXIV, 2003, Abstract no. 1854.
9. Forget, F., Hourdin, F., and Talagrand, O., CO2 Snow Fall on Mars: Simulation with a General Circulation Model, Icarus, 1998, vol. 131, pp. 302–316.
10. Haberle, R.M., Pollack, J.B., Barnes, J.R., et al., Mars Atmospheric Dynamics as Simulated by the NASA AMES General Circulation Model. I—the Zonal-Mean Circulation, J. Geophys. Res., 1993, vol. 98, pp. 3093–3123.
11. Karatekin, O., Dehant, V., and de Viron, O., Martian Global— Scale Seasonal CO2 Change: Comparison of Geodetic Observations and Numerical Simulations, 6th Int. Conf. on Mars, Pasadena, 2003, Abstract # 3172.
12. Kieffer, H.H., Martin, T.Z., Chase, S.C., et al., Martian North Pole Summer Temperatures—Dirty Water Ice, Science, 1976, vol. 194, p. 1341.
13. Kieffer, H.H. et al., Mars South Polar Spring and Summer Temperatures—a Residual CO2 Frost, J. Geophys. Res., 1979, vol. 84, p. 8263.
14. Kuzmin, R.O., Zabalueva, E.V., Mitrofanov, I.G., et al., Regions of Potential Existence of Free Water (Ice) in the Near-Surface Martian Ground: Results from the Mars Odyssey High-Energy Neutron Detector (HEND), Astron. Vestn., 2004, vol. 38, no. 1, pp. 1–13 [Sol. Syst. Res. (Engl. Transl.), 2004, vol. 38, no. 1, p. 1].
15. Leighton, R.B. and Murray, D.C., Behavior of Carbon Dioxide and Other Volatiles on Mars, Science, 1966, vol. 153, p. 136.
16. Litvak, M.L., Mitrofanov, I.G., Kozyrev, A.S., et al., 4-D model of CO2 deposition at North and South of Mars from HEND/ODYSSEY and MOLA/MGS, 6th Int. Conf. on Mars, Pasadena, 2003a, Abstract # 3040.
17. Litvak, M.L., Mitrofanov, I.G., Kozyrev, A.S., et al., Seasonal CO2 Observations on North and South of Mars as Seen by HEND (Mars Odyssey) and MOLA (MGS), LPS XXXIV, 2003b, Abstract # 1103.
18. Litvak, M.L., Mitrofanov, I.G., Kozyrev, A.S., et al., Seasonal Neutron-Flux Variations in the Polar Caps of Mars as Revealed by the Russian HEND Instrument Onboard the NASA 2001 Mars Odyssey Spacecraft, Astron. Vestn., 2003, vol. 37, no. 5, pp. 413–422 [Sol. Syst. Res. (Engl. Transl.), 2003c, vol. 37, no. 5, p. 378].
19. Masarik, J. and Reedy, R.C., Gamma Ray Production and Transport in Mars, J. Geophys. Res., 1996, vol. 101, pp. 18891–18912.
20. Mitrofanov, I.G., Anfimov, D.S., Kozyrev, A.S., et al., Maps of Subsurface Hydrogen From High Energy Neutron Detector, Science, 2002, vol. 297, pp. 78–81.
21. Mitrofanov, I.G., Zuber, M.T., Litvak, M.L., et al., CO2 Snow Depth and Subsurface Water-Ice Abundance in the Northern Hemisphere of Mars, Science, 2003a, vol. 300, pp. 2081–2084.
22. Mitrofanov, I.G., Litvak, M.L., Kozyrev, A.S., et al., Vertical Distribution of Shallow Water in the Distinguishable Regions at Low and High Latitudes of Mars: Neutron Data Deconvolution of HEND, 6th Int. Conf. on Mars, Pasadena, 2003b, Abstract # 3080.
23. Mitrofanov, I.G., Litvak, M.L., Kozyrev, A.S., et al., Search for Water in Martian Soil Using Global Neutron Mapping by the Russian HEND Instrument Onboard the US 2001 Mars Odyssey Spacecraft, Astron. Vestn., 2003c, vol. 37, no. 5, pp. 400–412 [Sol. Syst. Res. (Engl. Transl.), 2003, vol. 37, no. 5, p. 366].
24. Mohlmann, D., Adsorption Water in Mid and Low Latitude Martian Soil, Proc. of the Second European Workshop on Exo/Astrobiology, 2002, SP-518, pp. 169–172.
25. Paige, D.A., Herkenhoff, K.E., and Murray, B.C., Mariner 9 Observations of the South Polar Cap of Mars—Evidence for Residual CO2 Frost, J. Geophys. Res., 1990, vol. 95, p. 1319.
26. Rieder, R., Economou, T., Wanke, H., et al., The Chemical Composition of Martian Soil and Rocks Returned by the Mobile Alpha Proton X-Ray Spectrometer: Preliminary Results From the X-Ray Mode, Science, 1997, vol. 278, p. 1771.
27. Smith, D.E., Zuber, M.T., and Neumann, G.A., Seasonal Variations of Snow Depth on Mars, Science, 2001, vol. 294, pp. 2141–2146.
28. Smith, D.E. and Zuber, M.T., The Masses of Mars's Seasonal Polar Icecaps, 3th Int. Conf. on Mars Polar Sci., 2003, Abstract # 8063.
29. Soderblom, L.A., The Composition and Mineralogy of the Martian Surface From Spectroscopic Observations—0.3 Micron to 50 Microns Mars Book, Arizona Press, Space, Sci. Ser., 1993, pp. 557–593.
30. Tillman, J., Johnson, N.C., Guttorp, P., et al., The Martian Annual Atmospheric Pressure Cycle—Years Without Great Dust Storms, J. Geophys. Res., 1993, vol. 98, pp. 10963–10971.
31. Yoder, C.F., Konopliv, A.S., Yuan, D.N., et al., Fluid Core Size of Mars From Detection of the Solar Tide, Science, 2003, vol. 300, pp. 299–303.
