")
")
Water Distribution in Martian Permafrost Regions from Joint Analysis of HEND (Mars Odyssey) and MOLA (Mars Global Surveyor) Data
N. E. Demidov1, W. V. Boynton2, D. A. Gilichinsky1, M. T. Zuber3, A. S. Kozyrev4, M. L. Litvak4, I.G.Mitrofanov4, A.B.Sanin4, R. S. Saunders5, D.E.Smith6, V. I. Tretyakov4, and D. Hamara2
1Institute of Physical–Chemical and Biological Problems of Soil Science, Russian Academy of Sciences, Pushchino, Russia
2University of Arizona, Tucson, USA
3Department of Earth, Atmospheric and Planetary Sciences, Massachusetts Institute of Technology, Cambridge, Massachusetts, USA
4Space Research Institute, Russian Academy of Sciences, Profsoyuznaya ul. 84/32, Moscow, 117997 Russia
5NASA Headquarters, Washington D.C., USA
6NASA Goddard Space Flight Center, Greenbelt, Maryland, USA
Abstract - We jointly analyze data from the High-Energy Neutron Detector (HEND) onboard the NASA Mars Odyssey spacecraft and data from the Mars Orbiter Laser Altimeter (MOLA) onboard the Mars Global Surveyor spacecraft. The former instrument measures the content of hydrogen (in the form of Н2О or OH) in the subsurface layer of soil and the latter instrument measures the surface albedo with respect to the flux of solar energy. We have checked the presence of a correlation between these two data sets in various Martian latitude bands. A significant correlation has been found between these data at latitudes poleward of 40° in the northern hemisphere and at latitudes 40°−60° in the southern hemisphere. This correlation is interpreted as evidence for the presence of stable water ice in these regions under a dry layer of soil whose thickness is determined by the condition for equilibrium between the condensation of water from the atmosphere and its sublimation when heated by solar radiation. For these regions, we have derived an empirical relation between the flux of absorbed solar radiation and the thickness of the top dry layer. It allows the burial depth of the water ice table to be predicted with a sub-kilometer resolution based on nearinfrared albedo measurements.We have found no correlation in the southern hemisphere at latitudes >60°, although neutron data also suggest that water ice is present in this region under a layer of dry soil. We conclude that the thickness of the dry layer in this region does not correspond to the equilibrium condition between the water ice table and the atmosphere.
DOI: 10.1134/S1063773708100071 - http://www.springerlink.com/content/f70uu707747213l5/
-------------------------------------------------------------------------------------------------------------------------------------------------
THE INFLUENCE OF SURFACE ALBEDO ON VARIOUS FORMS OF WATER IN THE SOIL
CORRELATION ANALYSIS OF MARTIAN NEUTRON FLUX
AND SURFACE ALBEDO MEASUREMENTS
DISCUSSION AND INTERPRETATION OF THE RESULTS OF OUR CORRELATION ANALYSIS
-------------------------------------------------------------------------------------------------------------------------------------------------The Russian High-Energy Neutron Detector (HEND) onboard the NASA Mars Odyssey spacecraft has been operating in an orbit around Mars as part of theGRS (Gamma-Ray Spectrometer) instrumentation (Boynton et al. 2002) since October 2001. The measurements of neutron emission from the Martian surface with this instrumentation revealed huge deposits of water ice in the subsurface layer of Martian soil and made it possible to establish their regional distribution (Boynton et al. 2002; Feldman et al. 2002; Mitrofanov et al. 2002, 2004a). A joint analysis of neutron data with data from other instruments that characterize the physical properties of the soil material is need for an unambiguous geological interpretation of these data—determining the form of water existence in the soil, refining its vertical distribution in the layer under study, and revealing the factors that control the water content and explain its detected spatial variations.
The northern ice-rich permafrost (NIP) and southern ice-rich permafrost (SIP) regions on Mars, in which, according to neutron measurements, the water ice content in the soil can reach several tens of percent (by weight) (Mitrofanov et al. 2004b; Litvak et al. 2006), are of particular interest in this respect. The NIP and SIP regions have similar neutron fluxes, while their boundaries are located approximately symmetrically relative to the equator northward and southward of latitudes 55°−60°. At the same time, these regions are known to differ both in terrain elevation and in mesorelief structure. The NIP region lies at negative elevations from −1 to −6 km relative to the dichotomy (the structural boundary between the two hemispheres that roughly corresponds to an elevation of 0 m) and is characterized by a lightly cratered surface of the late Hesperian epoch. In contrast, the SIP region is formed by ancient rocks of the Noachian epoch, is heavily cratered, and lies well above the dichotomy at elevations from +1 to +4 km. In addition, the SIP and NIP regions are characterized by different intensities of dust storms (Martin and Zurek 1993) and different fluxes of solar radiation due to the relationship between the seasonal cycle ofMars and the eccentricity of its orbit. It would be natural to assume that these differences between NIP and SIP can be reflected in the peculiarities of water ice burial in the soil of these two regions. Indeed, the neutron measurements for NIP agree well with the simplest model of soil with homogeneous ice burial in depth. On the other hand, analysis of the neutron data for SIP shows that the structure of its soil is inconsistent with the simplest homogeneous model and is described by a two-layer model with a top dry layer of soil 10−20 cm in thickness above an ice-rich bottom layer (Mitrofanov et al. 2004b; Litvak et al. 2006).
The conditions for the generation of Martian neutron emission are such that it is virtually impossible to unambiguously determine the vertical distribution of water in the soil if we restrict ourselves only to the data on the neutron flux from the surface. The point is that the neutrons emerging from the surface are generated at all depths in a layer of soil about 2 m in thickness and, mathematically, their known flux is an integral convolution of the unknown functions of neutron production, diffusion, and absorption over the entire depth. This integral equation is known to have no unique solution. To solve it, one has to use a model-dependent function of the water content at various soil depths and to compare the neutron fluxes calculated for it with the results of measurements. This procedure should take into account the detector efficiencies, the atmospheric model, and the spectral Galactic cosmic ray flux density. Previously (Mitrofanov et al. 2004b; Litvak et al. 2006), the soil structure was considered in the most simplified form based on a homogeneous or two-layer model with one (water content) or two (burial depth and water content) free parameters, respectively. Using a probabilistic approach based on minimization procedures and goodness-of-fit tests, the parameters that fitted best the experimental data in the context of each model have been selected. It turned out (Mitrofanov et al. 2004b; Litval et al. 2006) that the structure of the water ice table is better described by the onelayer and two-layermodels in the north and the south, respectively. A further study of the soil structure requires invoking additional data that would allow the field of parameters to be narrowed. In this paper, we analyze the HEND measurements using nearinfrared (IR) surface albedo measurements. First, we check the presence of a correlation between the neutron and albedo data for various latitude belts. The presence and pattern of such a correlation can be the additional condition that will allow the model for the depth structure of ice-rich layers to be improved.
Below, we show that the suggested approach allows several important conclusions about the nature of the Martian permafrost regions to be reached: to reveal one of the main factors that control the burial depth of the water ice table in certain regions within SIP and NIP, to refine the boundaries of these regions and explain their latitude deviations, and to ascertain the distribution of water ice in the SIP and NIP regions.
AN OVERVIEW OF THE RESULTS OF SEARCHES FOR A CORRELATION BETWEEN NEUTRON DATA AND OTHER SURFACE PARAMETERS 
Various researchers have compared the neutron data and gamma-ray data from the GRS instrument with such surface parameters as the absolute relief elevations, thermal inertia, albedo, surface temperature, geological features of the surface, the presence of polygons, etc.
Bazilevsky et al. (2003) compared the maps of epithermal and fast neutrons (HEND data) with the reliefmap, themap of thermal inertia, and the geological map for the equatorial latitude belt 60° S–60° N. A visual comparison of these maps led these authors to conclude that the neutron flux showed no correlation with the surface elevation, geological structure, and thermal inertia. The correlation coefficients between the epithermal neutron flux in the latitude belt 45° S– 45° N and a set of such physical parameters of the surface as the latitude, temperature, surface elevation, thermal inertia, albedo, etc. were quantitatively estimated by Yakovsky et al. (2005). In none of the cases did the correlation coefficient exceed a statistically significant value. Tokano (2003) estimated the same correlation coefficients with a similar set of surface parameters, but, in this case, the correlation was calculated for the entire Martian surface. The correlation coefficient between the epithermal neutron flux (HEND data) and the mean surface temperature was found to be +0.7.
The significant drawback of the search for a correlation for the entire surface or within broad latitude bands is that there is a global tendency for the neutron flux to decrease with increasing distance from the equator poleward. For this reason, the estimated correlation coefficients for the entire surface reflect not the presence of a real correlation, when a given physical parameter of the surface affects the neutron flux, but the presence of a global latitude trend for this parameter. The presence of global trends in two data sets will always give rise to a correlation. For example, in the paper by Tokano (2003), the correlation of the neutron flux with the albedo (at a level of−0.3) results from the presence of light polar caps at the Martian poles, while the high correlation of the neutron flux with the mean surface temperature (at a level of +0.7) is the result of a systematic decrease in temperature poleward.
Feldman et al. (2005) visually compared the water contents estimated from neutron measurements with the albedos and terrain elevations along longitude profiles within the latitude band from 60° S to 60° N. The authors found no correlation with the albedo, but they concluded that there existed a correlation between the water content and the surface elevation. The two results require a further study, since the latitude trends of the terrain elevation and the water content were not eliminated in the method used for a visual analysis of the longitude profiles.
Kuzmin et al. (2004) showed a correlation between the abundance of regions with a polygonal relief and high latitudes (almost all of the detected regions with a polygonal relief fall into NIP or SIP). However, the contour of the NIP and SIP boundaries near the latitude belt 55°−60° identified by neutron measurements does not correlate with the locations of the detected polygons. The neutron flux variations within the permafrost regions do not correlate with the locations of the polygons either. It should be noted that since a large fraction of high-resolution images was not used when the polygon abundance maps were compared, these maps may not be detailed enough to be considered for the purposes of searching for correlations. Therefore, it may well be that due to the established general tendency for the polygonal forms to correlate with high latitudes, a fuller mapping of these forms can reveal correlations with the regional neutron flux variations.
THE INFLUENCE OF SURFACE ALBEDO ON VARIOUS FORMS OF WATER IN THE SOIL
The main forms of water existence in the subsurface layer of Martian soil are known to be ice, chemically bound water, and physically bound (adsorbed) water (Bazilevsky et al. 2003; Paige 1992; Bish et al. 2003; Chou and Seal 2007). The content of bound water is determined by the mineral composition of the surface soil. Clay minerals and aqueous sulfates may be the main hydrous minerals in the Martian soil (Bibring et al. 2006). The laboratory experiments aimed at studying the degree of hydration of clay minerals and sulfates in the ranges of temperatures and relative humidities characteristic of Mars are known to show a relationship between the degree of their hydration and the conditions in the surrounding atmosphere (Bish et al. 2003; Chou and Seal 2007). However, the available experimental data reflect the behavior of samples with a very small volume. Clays and sulfates are probably present in the soil in the form of large grains or mineral aggregates. The diurnal and seasonal variations in temperature and relative humidity can affect the hydration of only the uppermost surface layer of these grains, because the migration rates of bound water in the mineral structure are very low (Mellon and Jakosky 1993). This is indirectly confirmed by the change in the color of the grain surface after its contact with the atmosphere once the surface was uncovered by the wheels of a Martian rover (Wang et al. 2006). Since the mass fraction of the top layer of grains with a variable degree of hydration with respect to the total mass of the mineral is negligible, the effects of diurnal and seasonal variations in the degree of mineral hydration may be neglected when the neutron flux from the top layer of the planet is estimated.
It is currently believed that ice in the soil can be present from the surface to a very large depth in Martian regions with a sufficiently low temperature, below −75°C (Paige 1992; Clifford 1993). Its concentration at large depths is determined by the rock porosity and formation conditions. The presence of ice in the immediate vicinity of the surface depends largely on the temperature variations produced by heating by solar radiation. Qualitatively, it can be asserted that the surface in high-albedo regions is heated weakly and, accordingly, more favorable conditions are created for the existence of ice near the surface—the ice burial depth in such regions can be relatively small. In contrast, the subsurface layer in low-albedo regions is heated strongly and the conditions for the existence of stable ice in this layer deteriorate—the ice burial depth in such regions should be large. The physical mechanism of the albedo effect on the neutron flux may be related to the formation of the socalled equilibrium dry layer (EDL) above the water ice table whose thickness is determined by the balance between the condensation of water vapor from the atmosphere and the sublimation of water ice on the water ice table (Paige 1992; Aharonson and Schorghofer 2006).
Since the neutron flux from the surface should decrease or increase with decreasing or increasing depth of the water ice table, the presence of a negative correlation between the neutron flux variations and the surface albedo would indicate that the neutron flux variations reflect mainly the change in the burial depth of water ice in the soil under the dry subsurface layer of soil whose thickness meets the EDL condition. Thus, the presence of such a correlation would point to a general relationship between the mean burial depth of ice in the soil of various regions along the chosen latitude belt of Mars and the flux of solar radiation absorbed by them. The EDL thickness is determined mainly by the flux of absorbed solar radiation, which is proportional to (100 − A), where A is the surface albedo for solar radiation (in %). If the mean soil temperature is low enough for the existence of stable ice, then the EDL thickness will be larger where the absorbed solar energy is larger.
The nonequilibrium case where the depth of the water ice table is not determined by the condition for equilibrium between condensation and sublimation should not be excluded from consideration either. Such a situation can arise when the top dry layer has a large thickness and a low penetrability to prevent the diffusion of water vapor from the water ice table or this layer has not yet reached its equilibrium thickness according to the conditions for its formation. In this case, the top layer can be defined as a nonequilibrium dry layer (NDL).
The two physically different cases of the existence of a water ice table under the dry layer of soil, EDL and NDL, probably exhaust the physical conditions for the burial of water ice beneath the Martian surface.
CORRELATION ANALYSIS OF MARTIAN NEUTRON FLUX AND SURFACE ALBEDO MEASUREMENTS
When selecting the surface regions for our search for a correlation between the neutron flux and albedo data, we took into account the strong latitude dependence of both the incident flux of solar radiation and the neutron flux. To exclude these factors from consideration, we decided to estimate the degree of correlation for surface pixels with the same latitude. We chose 32 latitude bands from 80° S to 80° N with a 5° width. Each band was broken down into 72 5° × 5° pixels and the neutron flux and albedo for these pixels were used to estimate the correlation between them. The regions poleward of 80° were excluded from consideration, because the ice polar caps make a major contribution to the albedo there and ice lies directly on the surface.
For each latitude band, we estimated the presence of a physical relationship between the neutron flux and albedo by calculating Spearman's correlation coefficient with allowance made for the instrumental measurement errors. The correlation of 72 values was considered significant with a probability of 0.997 (3σ) if the correlation coefficient exceeded 0.325 (Aivazyan et al. 1985).
Mitrofanov et al. (2003) described in detail the procedure for mapping the neutron flux from the surface based on HEND data. Figure 1 presents a map for the epithermal neutron flux fn, which is used below to estimate the correlation coefficient. Since epithermal neutrons are known to best reflect the water concentration variations in the soil, using this map corresponds most closely to the goals of this paper. The map corresponds to a surface free from seasonal carbon dioxide deposits. The exposure time of themap corresponds to Ls = 0°−360° for the latitude band 60° S−60° N, Ls = 90°−180° for the northern highlatitude region >60° N, and Ls = 270°−360° for the southern high-latitude region >60° S. The spatial resolution of the map corresponds to a 5° × 5° pixel, or a region with a size of about 300 × 300 km on the equator.
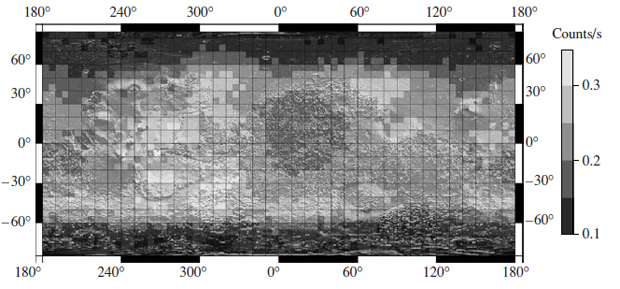
Fig. 1. Map of the epithermal neutron flux from the Martian surface free from СО2 cover based on HEND/NASA 2001 Mars Odyssey data.
The MOLA laser altimeter has performed active radiometry of theMartian surface, measured the laser radiation at a wavelength of 1064 nm reflected from the surface, since the beginning of the NASA Mars Global Surveyor in 1999. Passive radiometry of the surface was also performed between laser pulses—the albedo A1064 at 1064 nm was measured for the sunlit Martian surface within the detector's field of view corresponding to a spot of about 385 m on the surface (Zuber et al. 2003). Once the laser source ceased to operate in June 2001, the MOLA instrument continued to operate as a passive radiometer (Sun et al. 2006). The passive radiometry data have an accuracy of more than 2%. They demonstrate a high stability outside the polar regions, where CO2 condensation takes place. In searching for a correlation between the radiometry and neutron data in 5° × 5° pixels, we averaged the MOLA data over these surface pixels (Fig. 2). To eliminate the effects of carbon dioxide condensation from the radiometry data, the exposure times for the Northern and Southern Hemispheres were Ls = 150°−165° and Ls = 330°−345°, respectively.
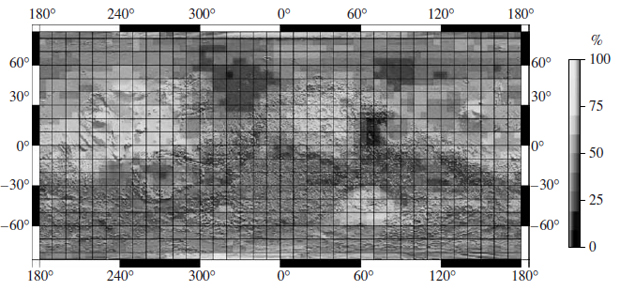
Fig. 2. Near-IR albedomap for the Martian surface free from СО2 cover based onMOLA/NASAMars Global Surveyor data.
The correlation coefficients between the epithermal neutron flux fn and the near-IR albedo A1064 calculated for each individual latitude band using the technique described above are presented in Fig. 3. The significance of the correlation coefficient estimated by Student's test shows that the correlation effect may be considered statistically significant with a probability of 0.997 if it exceeds 0.325 in absolute value. It follows from the estimates of the correlation coefficients for the Martian latitude bands that the surface of this planet from 80° S to 80° N can be divided into four latitude belts (Fig. 3) that differ in how this effect manifests itself in them. In the extended latitude belt I (40° S−40° N), the correlation coefficients between fn and A1064 turn out to be below the significance threshold for all latitude bands. This means that, in general, there is no physical relationship between them. The absence of a correlation is confirmed by the almost random distribution of points on the scatter plots (Figs. 4d–4f).
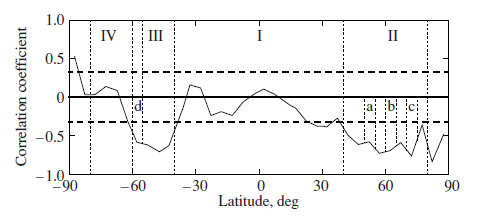
Fig. 3. Correlation coefficients between the neutron flux and near-IR albedo in various latitude bands. The significance threshold is indicated by the dashed lines. The dotted lines separate the belts with different patterns of correlation. The four latitude bands used to make a model-dependent comparison between the dry-layer thickness and the absorbed solar energy are highlighted by the dashes and denoted by the letters.
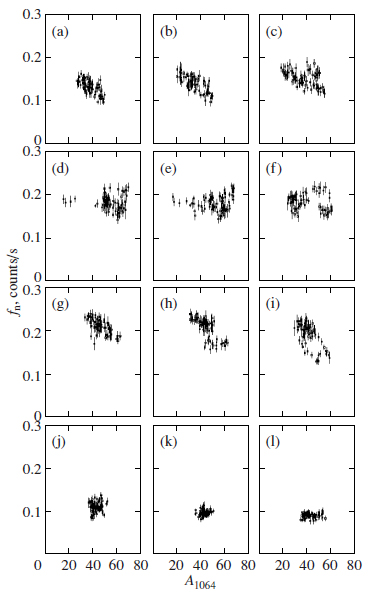
Fig. 4. Epithermal neutron flux–near-IR albedo scatter plots for various latitude bands: (a) 60° N−65° N, (b) 55° N−60° N, (c) 50° N−55° N, (d) 10° N−15° N, (e) 0° N−5° N, (f) 10° S−15° S, (g) 40° S−45° S, (h) 45° S−50° S, (i) 50° S−55° S, (j) 65° S−70° S, (k) 70° S−75° S, (l) 75° S−80° S.
At the same time, it should be noted that the curves of the conditional A1064 distributions for four different fn ranges show that some relationships between these two surface characteristics still exist (Fig. 5). The regions with the minimum neutron flux (fn < 0.175) show a clear tendency to have a relatively high albedo (A1064 > 50). Indeed, the northern part of Arabia Terra with a low neutron flux has a high albedo. The Memnonia region with a low neutron flux is also characterized by a fairly high albedo. At the same time, the reverse is not true— a considerable number of pixels with the maximum neutron flux (fn > 0.225) are also observed within the Tharsis Bulge with high albedos. These trends probably point to the coexistence of several regions in this belt with various physical relationships between the presence of water in the soil and the albedo of its surface. However, it is obvious that there is no main region among them that could dominate in the equatorial belt.
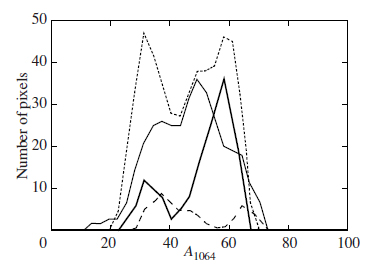
Fig. 5. Conditional near-IR albedo distributions for four ranges of epithermal neutron fluxes (fn): fn < 0.175 (thick line), 0.175 < fn < 0.2, (dotted line), 0.2 < fn < 0.225 (thin line), fn > 0.225 (dashed line).
In the northern latitude belt II (40° N−80° S), we found a significant negative correlation between fn and A1064 at middle and high latitudes of the northern hemisphere. The correlation coefficient increases from 0.325 at 42.5° N to 0.750 at 72.5° N (Fig. 3). The correlation between fn and A1064 is also clearly seen on the scatter plots (Figs. 4a–4c). The negative sign of the correlation coefficients suggests that the neutron flux decreases with increasing near- IR albedo. Figure 6 presents the longitude profiles of the correlation between fn and A1064 for the latitude bands 70° N−75° N and 45° N−50° N. These profiles allow the regions in belt II that make the largest contribution to the correlation to be determined qualitatively. Along the band 70° N−75° S, the neutron flux maximum in the longitude range 280° E−340° E corresponds to the minimum albedo. Similarly, in the band 45° N−50° N, the two neutron flux minima in the longitude ranges 120° E−170° E and 190° E−270° E also correspond to high albedos, while the two neutron flux maxima at longitudes 30° E−120° E and 270° E−340° E and the local maximum at longitudes 170° E−190° E correspond to low albedos. In general, it can be asserted that the negative correlation between the neutron flux and surface albedo in belt II results mainly from the contributions of five large regions in this belt: Acidalia Planitia (low albedo—high flux), the northern extremity of the Tharsis Bulge (high albedo—low flux), the western outskirts of Utopia Planitia (low albedo— high flux), the region to the north-northwest of Elysium Mons (high albedo—low flux), and the western part of Arcadia Planitia (low albedo—high flux).
In the southern latitude belt III (40° S−60° S), a significant negative correlation, 0.600−0.725, is also observed between fn and A1064 (Fig. 3). The values of fn and A1064 on the scatter plots for belt III also tend to fall on a straight line with a negative slope (Figs. 4g–4i). The difference between the southern belt III and the northern belt II is that belt III is narrower and has well-defined boundaries from the north and the south at which the correlation vanishes abruptly. The longitude profiles of the correlation between fn and A1064 for the latitude band 45° S−50° S show (Fig. 6) that the neutron flux minimum in the southern part of Hellas Planitia (30° E−170° E) coincides with high albedos. In contrast, the neutron flux maximum in Aonium Terra (240° E−300° E) spatially coincides with the albedo minimum.
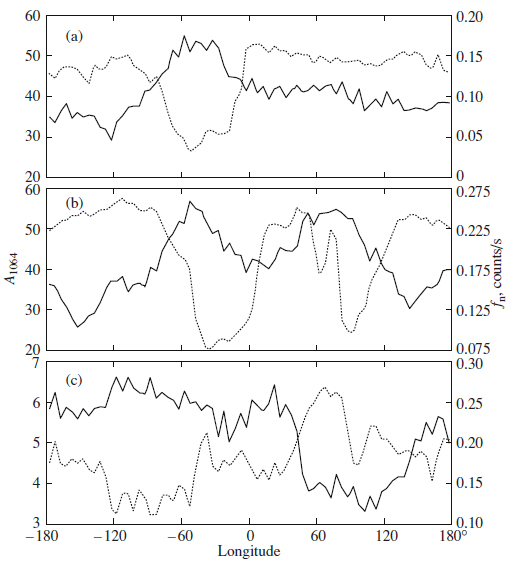
Fig. 6. Profiles of the correlation between near-IR albedo (dotted line) and epithermal neutron flux (solid lines) for various latitude bands: (a) 70° N−75° N, (b) 45° N−50° N, and (c) 45° S−50° S.
In belt IV, no significant correlation was found at high latitudes of the southern hemisphere (60° S−80° S).On the fn–A1064 scatter plots for this belt, the points are scattered randomly, confirming the absence of a correlation between them (Figs. 4j–4l).
DISCUSSION AND INTERPRETATION OF THE RESULTS OF OUR CORRELATION ANALYSIS
The absence of a correlation in the equatorial latitude belt I (40° S−40° N) means that the water content in the soil does not depend on the surface temperature conditions. The neutron flux variation in this belt is determined mainly by the variations in soil composition and in the content of bound water in the soil. Solar radiation is not the main factor that governs the water content in the soil of this belt. At the same time, the Arabia and Memnonia regions with low neutron fluxes and high near-IR albedos are known to be present in belt I. The contribution from these regions to the conditional A1064 distributions for four different fn ranges (Fig. 5) shows the same relationship between them as that observed for belts II and III with a strong correlation. The enhanced water content in the Arabia and Memnonia soil may be related in some way or another to a high surface albedo. First, these regions may contain fossil water ice (Bazilevsky et al. 2003) emerged there under different climatic conditions and protected from sublimation by an isolating layer of soil with a relatively low absorbed solar energy. Second, the soil material in these regionsmay have enhanced concentrations of aqueous magnesium sulfates (Chou and Seal 2007) that correspond to a high content of chemically bound water and may determine the high surface albedo. Thus, the question about the nature of water in the Arabia and Memnonia regions should still be considered an open one, but the absence of a significant correlation between the neutron flux and the surface albedo in the equatorial belt I may be considered to be an established fact.
The significant correlation between fn and A1064 in the latitude belts II and III probably suggests that an EDL whose thickness is determined by the absorbed solar energy lies above the water ice table. Analysis of HEND neutron data (Mitrofanov et al. 2002, 2004b; Litvak et al. 2006) and GRS gammaray data (Boynton et al. 2007) showed that the ice distribution in the subsurface layer could be satisfactorily described by a simple two-layer model. This model suggests the presence of a top dry layer with a variable thickness h and a bottom layer with a variable water content ζ. The soil composition in the top and bottom layers is assumed to correspond to that revealed by Mars Pathfinder data (Wanke et al. 2001) and the water content in the top layer is taken to be 2% by weight.
According to the two-layermodel, the spatial variations in the neutron flux from the surface can be explained either by variations in the thickness h of the top dry layer, or by variations in the water ice content ζ in the bottom layer, or by variations in both parameters. To explain the detected correlation in belts II and III, we can use this two-layer model of soil and additionally assume that the top dry layer has the physical nature of an EDL and that the spatial neutron flux variations are related to the variations in its thickness hEDL. The presence or absence of a statistically significant correlation between the estimated layer thickness hEDL and the total energy flux from solar radiation deep beneath the surface can serve as a criterion for the validity of this assumption.
To test this assumption, we chose four latitude bands within belts II and III with a high correlation: (a) 50° N−55° N, (b) 60° N−65° N, (c) 70° N−5° N in the north, and (d) 55° S−60° S in the south (Fig. 3). Based on our analysis of HEND data, we estimated the best-fit thickness of the top dry layer h(*)EDL for the two-layer model separately for each 5° × 5° pixel by assuming the water content in the bottom layer to be equal to the maximum value for the corresponding latitude band (for a description of the estimation procedure, see Litvak et al. (2006)). For each pixel, we also calculated the heating parameter W, which is equal to the flux of solar energy absorbed by the soil at noon in mid-summer. The heating parameter depends mainly on the fraction of the flux of absorbed solar radiation (100 − A1064), on the solar angle (|φ| − ε) at noon in mid-summer, where φ is the latitude of the place and ε = 25.2° is the inclination of the Martian rotation axis to the orbital plane, and on the distance to the Sun. It can be represented as
W = μF0(100−A1064) cos(|φ| − ε), (1)
where F0 is the flux of solar energy at the yearly mean distance of Mars from the Sun and the coefficient μ reflects the difference between the distances of Mars from the Sun in northern and southern mid-summers due to the ellipticity of the orbit, μN = 0.85 and μS = 1.2 for the northern and southern hemispheres, respectively.
Our calculations show that there is a significant correlation between h(*)EDL and W for each of the four chosen latitude bands: C[50° N−55° N] = +0.49, C[60° N−65° N] = +0.64, C[70° N−75° N] = +0.73, and C[55° S−60° S] = +0.58. Once the values of all four bands have been combined into one set, the correlation coefficient increases to +0.77. The physical relationship between the thickness of the top layer and the heating parameter is clearly seen in Fig. 7. Thus, the assumption being tested may be considered valid: the spatial neutron flux variation in the latitude belts II (40° N−80° N) and III (40° S−60° S) is well explained by the variation in the EDL thickness, which is determined by the absorbed solar energy.
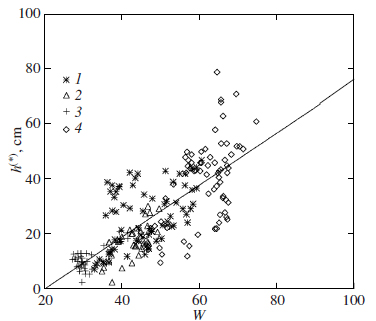
Fig. 7. (h(*),W) scatter plots for four latitude bands with a high correlation: 50° N−55° N (1), 60° N−65° N (2), 70° N−75° N (3), 55° S−60° S (4).
Using the parameters h(*)EDL and W for all four latitude bands (Fig. 7), we can find a simple empirical relation between the thickness hEDL of the EDL above the water ice table and the heating parameter W:
hEDL = k(W −W0), (2)
where the heating coefficient k = 0.95 cm/% has the physical meaning of an increment in EDL thickness (in cm) at a given point as the albedo decreases by 1%. The limiting heating parameter W0 = 20% corresponds to an inward energy flux at which the thickness of the top dry layer becomes zero, i.e., at which ice can stably exist on the surface.
The scatter of points in Fig. 7 relative to the empirical relation (2) is fairly large. It probably results from the actual difference in the physical properties of the soil in each individual pixel: first, the water ice content in the bottom layer can be different; second, the thermophysical properties of the soil that determine the depth profile of the temperature (thermal inertia, thermal conductivity, heat capacity) can differ; and, third, the degree of heating should differ depending on the inclination of the surface with respect to the north–south direction. At the same time, in our view, Eq. (2) describes the main physical mechanism that accounts for the detected strong negative correlation between the neutron flux and near-IR surface albedo the formation of an EDL in the latitude belts II and III that separates the water ice table from the atmosphere.
It is well known from neutron and gamma-ray measurements that a large amount of water ice, from 20 to 50%by mass, is present in the soil of the latitude belt IVunder a dry layer of soil 10−15 cmin thickness (Litvak et al. 2006; Boynton et al. 2007). The absence of a correlation between the neutron flux and near-IR albedo in this belt suggests that the burial depth of the water ice table is currently not determined by the condition for equilibrium between water condensation and sublimation, i.e., the water ice table is covered by a NDL. Two factors can be responsible for the NDL formation in the latitude belt IV. First, we can assume that the NDL in belt IV was formed under different climatic conditions and has a large thickness and a low penetrability to prevent the diffusion of water vapor and to isolate ice from the atmosphere. Second, we can assume that the water ice table currently retains contact with the atmosphere, but the thickness of the top dry layer is not in equilibrium. The spring (and, to a lesser extent, the summer) at high latitudes of the southern hemisphere is known to be accompanied by regular dust storms with the displacements of large masses of dust (Smith 2004). It is in the latitude belt IV that maximum albedo variations have been detected since the Viking observations of the Martian surface (Fenton et al. 2007). If significant masses of dust settle or are displaced in the latitude belt IV in the characteristic EDL formation time on the surface and its albedo changes significantly, then an equilibrium depth of the water ice table may not have time to be established. In our view, the main effect from dust storms that can affect the establishment of an equilibrium depth of the water ice table consists in changing the IR surface albedo. The appearance of a new dust layer on the surface with a thickness of several microns can change significantly the flux of absorbed solar energy and, hence, change the equilibrium ice burial depth.
According to neutron and gamma-ray data (Boynton et al. 2002; Feldman et al. 2002; Mitrofanov et al. 2002), the NIP and SIP boundaries run along the latitude band 55° −60°. On the other hand, a significant correlation was found between the neutron flux and the near-IR albedo in belts II and III, whose boundaries run at latitudes of about 40° in both hemispheres. At present, there exist a sufficient number of papers in which it was shown that the thermal conditions of the soil can provide a existence of water ice at latitudes poleward of 40°. Thus, for example, it follows from the calculations of Aharonson and Schorghofer (2006) that a stable existence of water ice is possible in high-albedo regions and in regions with poleward slopes starting from a latitude of 40°. Since there is a correlation between fn and A1064, it could be argued that the fraction of the Martian surface regions with stable ice should be fairly large starting from a latitude of about 40° and that the water ice table in the latitude belt 40°−60° in the south and everywhere poleward of 40° in the north is covered by an EDL. Note that it was concluded in previous papers devoted to the interpretation of HEND measurements that the presence of a top dry layer in the north was not confirmed by neutron observations. Based on GRS data, Boynton et al. (2006) showed that a relatively thin (about 3−20 cm) layer of dry regolith could also be present in the north. According to the empirical relation (2) derived from a joint analysis of neutron and IR-albedo measurements, the thickness of the top dry layer in the north is about 20 cm; this value agrees well with the gamma-ray measurements, but it is too low for the dry layer to be reliably detected on the basis of neutron measurements.
The deduced empirical relation (2) between the thickness of the dry layer above the water ice table and the near-IR albedo can have an interesting practical application. The spatial resolution of the neutron data corresponds to a scale of about 300 km, while the near-IR albedo data are available with a subkilometer resolution. For each surface region with a size of 300 km in the latitude belts II and III of interest to us, we can estimate the average thickness of the top dry layer h(*) and the average water content ζ(*) in the bottom ice-rich layer from HEND neutron measurements. For the same surface region, the average near- IR albedo A(*)1064 should be estimated from MOLA passive radiometry data. Next, the heating parameter W0 can be assumed to depend weakly on the local properties of the surface and to remain approximately the same, W0 = 20%, for all surface regions within belts II and III. Based on Eq. (2), we can then estimate the average heating coefficient k(*) from h(*) and A(*)1064. Using Eq. (2) with the derived heating coefficient and assuming that the water ice content at depth remains approximately constant and equal to the average value of ζ(*), we can calculate the burial depth of the water ice table hi for each subkilometer pixel i using near-IR albedo data based on MOLA radiometry data.
This approach allows us to increase significantly (by a factor of ∼ 1000 on a linear scale) the horizontal resolution of the neutron data to estimate the burial depth of the water ice table. Clearly, the assumption about a constant water ice content and the estimate of the heating coefficient in Eq. (2) based on averaged data for the original surface region can introduce a systematic error into the absolute estimate of the ice depth for a subkilometer pixel. On the other hand, Eq. (2) probably describes satisfactorily the relative depth ratio for different subkilometer pixels with different surface albedos and, hence, it would be appropriate to use this formula in searching for and identifying the subkilometer surface regions with the water ice burial closest to the surface.
The suggested method for increasing the spatial resolution based on a joint analysis of HEND neutron measurements and MOLA radiometry data can be useful for predicting the depth of the water ice table of permafrost at the landing sites of spacecraft on Mars. Thus, for example, the NASA Phoenix spacecraft should land in a high-latitude region of the northern hemisphere in the immediate future: the coordinates of its landing site are 65°−72° N and 120°−140° E. The thickness of the top dry layer of soil was estimated for this region by the suggested method to be 17 cm; in some of the subkilometer regions, the depth of the water ice table is 25 cm (Demidov et al. 2007). This method should also be used to search for optimal landing sites for the rover of the Martian scientific laboratory in 2009 and for prospective spacecraft that will take samples of soil and deliver them to the Earth. The landing of such a spacecraft in a region with a shallow water ice burial will allow the most important scientific and engineering task of delivering samples of Martian water ice to the Earth for investigations to be accomplished.
In general, we may conclude that our correlation analysis of the observational data for the neutron flux and near-IR albedo suggests the existence of two different types of ice-containing permafrost on Mars. The first type of permafrost lies in the northern hemisphere poleward of 40° (belt II) and in the southern hemisphere at latitudes 40°−60° (belt III). It covers almost the entire NIP region and the low-latitude SIP region. The water ice table of this type of permafrost is covered by an EDL and is currently in contact with the atmosphere. The EDL thickness is determined by the flux of absorbed solar energy and the water vapor pressure in the atmosphere. It follows from the condition for equilibrium between condensation and sublimation at each point on the water ice table that the total average water exchange between the surface and the atmosphere is zero—the characteristic time of change in EDL thickness is much shorter than the characteristic time of change in ice burial depth over the entire surface of this type of permafrost. For this type of permafrost, the burial depth of the water ice table can be estimated with a subkilometer resolution using the empirical relation (2) and HEND and MOLA observational data.
The second type of permafrost belongs to SIP and lies at high latitudes of the southern hemisphere (60°−80°). The water ice table for this type of permafrost is covered by a NDL. The thickness of this layer is not determined by the condition for equilibrium between water condensation and sublimation on the water ice table.
The reason why the top layer for the second type of permafrost is a nonequilibrium one has not yet been established. First, the equilibrium can be destroyed by some global cataclysm related either to a sudden increase in top-layer thickness or to a sudden decrease in water vapor pressure in the atmosphere. In this case, the permafrost in belt IV of SIP is the relic water ice deposits left from an early epoch of the planet, which are virtually isolated from the atmosphere at present. Second, the equilibrium of the top layer can be absent due to rapid surface-albedo variations in belt IV during dust storms. In this case, water ice directly interacts with the Martian atmosphere, but, at the same time, the time it takes for an equilibrium EDL thickness to be established in each surface region turns out to be much longer than the characteristic time of change in surface albedo in this region. It can be assumed that under these conditions of nonequilibrium ice contact with the atmosphere, both average outflow and inflow of water can be observed on the surface in the latitude belt IV as it interacts with the atmosphere depending on how the durations of the high- and low-albedo periods are related.
Which case of interaction between the water ice table and the atmosphere takes place for the second type of ice-containing permafrost on the present-day Mars remains unknown as yet and further studies should give an answer to this question.
We are grateful to the Program of the Russian President (project no. 02.120.11.19015) for Support of Young Russian Scientists (MD-265.2007.2).
1. O. Aharonson and N. Schorghofer, J. Geophys. Res. 111, E11007 (2006).
2. S. A. Aivazyan, I. S. Enyukov, and L. D. Meshalkin, Applied Statistics: Study of Relationships (Finansy i Statistika,Moscow, 1985).
3. A. T.Bazilevsky,M. L. Litvak, I.G.Mitrofanov, et al., Astron. Vestn. 37, 423 (2003) [Solar Syst. Res. 37, 387 (2003)].
4. J.-P. Bibring, Y. Langevin, J. F. Mustard, et al., Science 312, 400 (2006).
5. D. L. Bish, J. W. Carey, D. T. Vaniman, and S. J. Chipera, Icarus 164, 96 (2003).
6. W. V. Boynton, W. C. Feldman, S. W. Squeres, et al., Science 297, 81 (2002).
7. W. V. Boynton, D. M. Janes, M. Finch, et al., Fourth Mars Polar Sci. Conf. Abstract 8026 (2006).
8. W. V. Boynton, G. J. Taylor, L. G. Evans, et al., J. Geophys. Res. 112, E12S99 (2007).
9. I-Ming Chou and R. Seal II, J. Geophys. Res. 112, E11004 (2007). 10. S.M. Clifford, J. Geophys. Res. 98, E610973 (1993).
11. N. E. Demidov, W. V. Boynton, D. A. Gilichinsky, et al., Lunar Planet. Sci. Abstr. 38, 1640 (2007).
12. W. C. Feldman, W. V. Boynton, R. L. Tokar, et al., Science 297, 75 (2002).
13. W. C. Feldman, T. H. Prettyman, S. Maurice, et al., J. Geophys. Res. 110, E11008 (2005).
14. L. K. Fenton, P. E.Geissler, and R. M. Haberle, Lunar Planet. Sci. Abstr. 38, 1486 (2007).
15. B. M. Jakosky, M. T. Mellon, E. S. Varnes, et al., Icarus 175, 58 (2005).
16. R. O. Kuzmin, E. V. Zabalueva, I. G. Mitrofanov, et al., Astron. Vestn. 38, 3 (2004) [Solar Syst. Res. 38, 1 (2004)].
17. M. L. Litvak, I. G. Mitrofanov, A. S. Kozyrev, et al., Icarus 180, 23 (2006).
18. T. Z.Martin and R. W. Zurek, J. Geophys. Res. 98, 3221 (1993).
19. M. T. Mellon and B. M. Jakosky, J. Geophys. Res. 98, E2 (1993).
20. I. Mitrofanov, D. Anfimov, A. Kozyrev, et al., Science 297, 78 (2002).
21. I. G. Mitrofanov, M. L. Litvak, A. S. Kozyrev, et al., Astron. Vestn. 37, 400 (2003) [Solar Syst. Res. 37, 366 (2003)].
22. I. G. Mitrofanov, M. L. Litvak, A. S. Kozyrev, et al., Astron. Vestn. 38, 291 (2004a) [Solar Syst. Res. 38, 253 (2004a)].
23. I. G. Mitrofanov, M. L. Litvak, A. S. Kozyrev, et al., Solar System Res. 38, 253 (2004b).
24. D. A. Paige, Nature 356, 43 (1992). 25. M. D. Smith, Icarus 167, 1 (2004).
26. Xiaoli Sun, G. A. Neuman, J. B. Abshire, and M. T. Zuber, Appl. Optics 45, 3960 (2006).
27. T. Tokano, Int. J. Asrobiol. 2, 155 (2003).
28. A. Wang, L. A. Haskin, S. W. Squyers, et al., J. Geophys. Res. 111, E02S17 (2006).
29. H.Wanke, J. Bruckner, G. Dreibus, et al., Space Sci. Rev. 96, 317 (2001).
30. M. Zuber, D. Smith, and G. Neuman, Geophys. Res. Abstr. 5, 07625 (2003).
