")
")
Distribution of Hydrogen in the Near Surface of Mars: Evidence for Subsurface Ice Deposits
W.V.Boynton1, W.C.Feldman2, S.W.Squyres3, T.H.Prettyman2, J.Brückner4, L.G.Evans5, R.C.Reedy2,6, R.Starr7, J.R.Arnold8, D.M.Drake9, P.A.J.Englert10, A.E.Metzger11, Igor Mitrofanov12, J.I.Trombka13, C.d'Uston14, H.Wänke4, O.Gasnault14, D.K.Hamara1, D.M.Janes1, R.L.Marcialis1, S.Maurice15, I.Mikheeva1, G.J.Taylor16, R.Tokar2, C.Shinohara1
1 Lunar and Planetary Laboratory, University of Arizona, Tucson, AZ 85721, USA.
2 Los Alamos National Laboratory, Los Alamos, NM 87545, USA.
3 Center for Radiophysics & Space Research, Cornell University, Ithaca, NY 14853, USA.
4 Max-Planck-Institut für Chemie, 55020 Mainz, Federal Republic of Germany.
5 Science Programs, Computer Sciences Corporation, Lanham, MD 20706, USA.
6Institute of Meteoritics, University of New Mexico, Albuquerque, NM 87131, USA.
7 Department of Physics, The Catholic University of America, Washington, DC 20064, USA.
8 Department of Chemistry, University of California San Diego, La Jolla, CA 92093, USA.
9 TechSource, Sante Fe, NM 87505, USA.
10 Victoria University of Wellington, Wellington, New Zealand.
11Jet Propulsion Laboratory, California Institute of Technology, Pasadena, CA 91109, USA.
12 Space Research Institute, Moscow, Russia.
13 NASA/Goddard Space Flight Center, Greenbelt, MD 20771, USA.
14 Centre d'Etude Spatiale des Rayonnements, Toulouse, France.
15 Observatoire Midi-Pyrenees, 31400 Toulouse, France.
16 University of Hawaii, Honolulu, HI 96822, USA.
Abstract - Using the Gamma-Ray Spectrometer on the Mars Odyssey, we have identified two regions near the poles that are enriched in hydrogen. The data indicate the presence of a subsurface layer enriched in hydrogen overlain by a hydrogen-poor layer. The thickness of the upper layer decreases with decreasing distance to the pole, ranging from a column density of about 150 grams per square centimeter at –42° latitude to about 40 grams per square centimeter at –77°. The hydrogen-rich regions correlate with regions of predicted ice stability. We suggest that the host of the hydrogen in the subsurface layer is ice, which constitutes 35 ± 15% of the layer by weight.
DOI: 10.1126/science.1073722 - http://www.sciencemag.org/content/297/5578/81
There is ample evidence that water has been important in shaping the martian surface (1, 2) and that water is present on Mars today in the north polar residual cap (3). In more recent times, water may have flowed over the surface to form gullies (4), and ice may have been lost from zones of dissected duricrust (5).
Here, we report the presence of near-surface ice at two locations on Mars based on the determination of the depth dependence of hydrogen abundances in the upper meter of the martian regolith. The measurements were made with the Gamma-Ray Spectrometer (GRS) (6,7) on the Mars Odyssey mission. The GRS is a collection of three instruments used to determine the elemental composition of the martian surface. The instruments are the Gamma Subsystem, the Neutron Spectrometer, and the High Energy Neutron Detector. Data from the two neutron instruments are reported separately (8, 9). Here, we integrate the neutron data from (8) with the gamma-ray data and make quantitative estimates of the hydrogen distribution in the regolith and its implications for water-ice abundances.
The techniques of gamma-ray and neutron spectroscopy have been discussed in detail elsewhere (10,11). They rely on cosmic-ray particles, mostly protons and alpha particles with energies of a few GeV, as the excitation source. When cosmic rays strike the atmosphere and surface of Mars, they generate neutrons from other nuclei by various nuclear reactions. The neutrons then lose energy by collision with surrounding nuclei, and in the process they excite other nuclei, which then de-excite by emission of gamma rays. After the neutrons approach thermal energies, they can be captured by nuclei, which then also de-excite by emission of gamma rays. Some of the neutrons escape the planet's surface and can be detected in orbit. The flux of these leakage neutrons is indicative of the amount of moderation and capturing of the neutrons. These processes are a function of the composition of the surface and atmosphere because different elements have different cross sections for capture and have different abilities to moderate neutrons. Hydrogen is especially effective at moderating neutrons because its mass is nearly the same as that of the neutron.
The flux of both neutrons and gamma rays are affected by the subsurface composition of the regolith, but they have a different dependence on depth. The median depth from which the gamma-ray signal is detected occurs at a column density of about 20 g/cm2, but if the H concentration is enriched at depth, the median depth is greater. Neutrons are conventionally divided into three different energy bands: fast, epithermal, and thermal (11). The fast neutrons that escape to orbital altitudes have a depth dependence comparable to that of the gamma rays, but they do not convey as much information relevant to the distribution of H and will not be used in this work. The epithermal and thermal neutrons are sensitive to depths two or three times greater than the depth for gamma rays.
The GRS returns several neutron spectra and a gamma spectrum about every 20 s, which is the equivalent of one degree of motion or 59 km over the surface. The data are then binned over regions of interest to improve statistics. The emission line from hydrogen is readily apparent in the spectrum from the south polar region (Fig. 1), but the hydrogen signal in the mid-latitudes is nearly absent. For this work, we have binned the data in 5° latitude bands over longitudes from 90° to 210°E (Fig. 2). For most of the planet, the hydrogen gamma signal is very small, but in the south a clear increase is seen with decreasing distance to the pole. This increase toward the south pole is correlated with a reduction in epithermal neutron flux, which independently indicates an increase in H (8, 9).
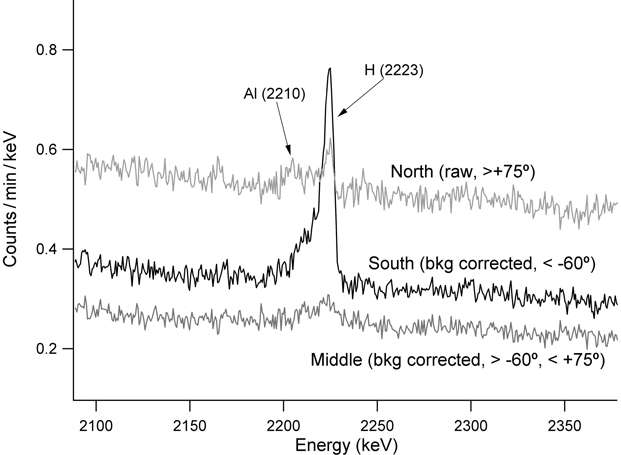
Fig. 1. Portions of the Odyssey gamma-ray spectra showing the emission line due to capture of thermal neutrons by hydrogen. The boom on which the gamma sensor is located has not yet been erected, so we get a small background contribution from hydrogen in the spacecraft. Spectra accumulated over the region in the northern latitudes are used to generate a spacecraft background spectrum, as this region is covered by a thick CO2 frost that is nearly opaque to gamma rays (24). bkg, background.
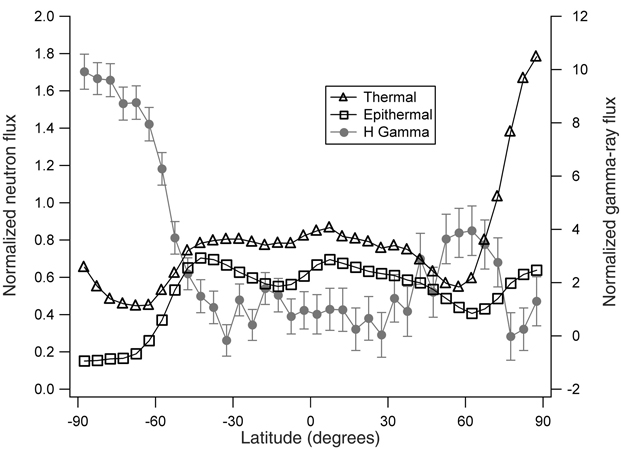
Fig. 2. Normalized fluxes of neutrons and H gamma rays versus latitude. The data are averaged over longitudes 90° to 210°E. These longitudes were chosen to be as far as possible from the residual CO2 cap in the south, which could have a major effect on the flux of thermal neutrons, similar to that observed in the north due to the seasonal CO2 frost. The increase in H gamma-ray emission south of about –45° is clearly evident, as is an enrichment in the north. The enrichment in the north does not continue to the pole because the north polar region is currently covered by a thick seasonal CO2 cap. Note the anticorrelation between the H gamma-ray flux and the epithermal neutron flux.
Relating these data to the distribution of H in the surface is not straightforward. If the flux of neutrons is constant and an element is uniformly distributed with depth, then the concentration of the element is directly proportional to the gamma signal strength. For the case of H, which has a major effect on the thermal neutron flux and whose concentration can vary with depth, the relation between concentration and gamma signal is complex. Here we used a Monte Carlo code, MCNPX (12, 13), to calculate the expected neutron and gamma signal strength for a variety of one- and two-layered regolith models with different atmospheric thicknesses to account for variations due to topography. For all models, we assumed the concentration of elements other than H was that of the soil measured by the Mars Pathfinder Alpha Proton X-Ray Spectrometer (14). We then normalized the results to unity for a soil with the equivalent of 1% H2O by weight.
For models of homogeneous regoliths with varying amounts of H2O, the epithermal neutron flux decreases monotonically with increasing H2O content (Fig. 3). The thermal neutron flux, by contrast, first increases as the H2O content increases up to about 10% by weight, after which the flux then decreases as the H2O content continues to increase. This variation in the thermal flux occurs because H is a very effective moderator of neutrons, essentially converting epithermal neutrons into thermal neutrons. At high H content, however, the thermal flux decreases due to capture of the thermal neutrons by H nuclei. In the layered model, the thermal flux decreases rather than increases as the H2O-poor upper layer gets thinner; it increases again after reaching a minimum at a thickness (column density) of around 60 g/cm2. The thermal flux decreases because the large H content of the subsurface layer acts as a sink to remove the thermal neutrons that diffuse down from the low-H surface layer. The fact that we see a correlated decrease in the thermal and epithermal neutron flux south of –42° (Fig. 2) indicates that the regolith is layered with a greater H2O content below the surface.
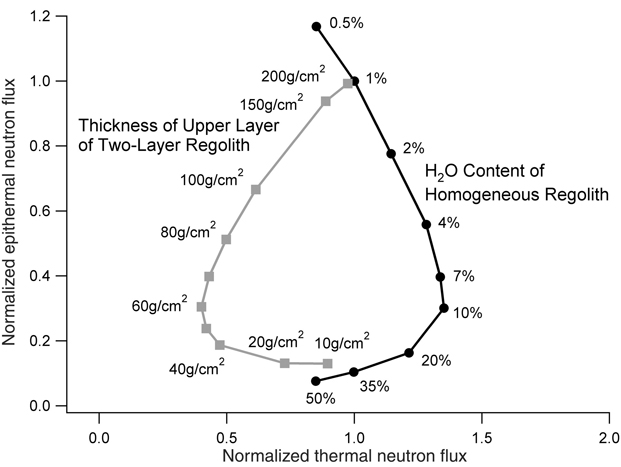
Fig. 3. Calculated epithermal neutron flux versus thermal neutron flux for two different models of the martian regolith. The right curve shows the variation for homogeneous- regolith models with different H2O contents. The left curve shows the variation for two-layer models in which the upper layer has 1% H2O, the lower layer has 35% H2O, and the thickness of the upper layer varies as shown (in units of column density).
To quantify this conclusion, we present several different two-layer models (Fig. 4) and compare them with the observed neutron fluxes. The data from the neutron spectrometer have been normalized to 1% H2O by weight at the location of the Viking 1 landing site (15, 16). Beginning at –42° latitude, as the distance to the south pole decreases, both the thermal and epithermal neutron fluxes decrease together until about –60° latitude, where the thermal flux plateaus and then begins to increase. The data agree with the model calculations, and the deviations almost certainly indicate that the actual distribution of H in the regolith is more complex than our model of two homogeneous layers with a sharp boundary. The data are also consistent with the upper layer having an H2O content of about 1% by weight near –42° latitude and increasing to 2% near –62°. The exact value of the H2O content at the surface is dependent on the normalization to the Viking 1 region and is thus not an independent determination. The data are also consistent with the lower layer having an H2O content of 35 ± 15% by weight, but this determination is not strongly dependent on the normalization value.
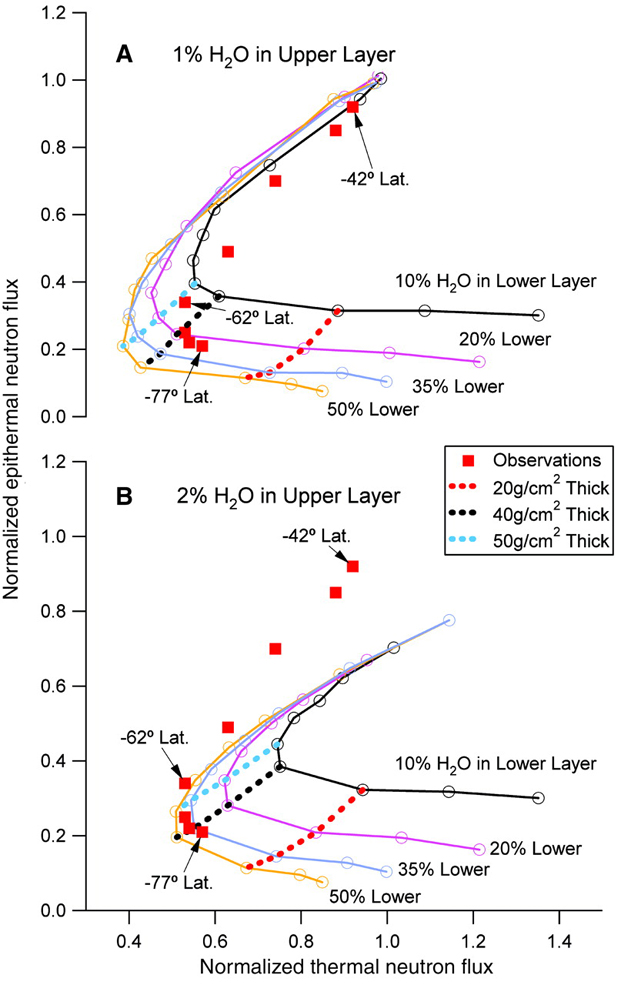
Fig. 4. Calculated and observed epithermal neutron flux versus thermal neutron flux for a family of Mars regolith models. The calculations are for different two-layer models similar to the example in Fig. 3. (A) 1% H2O in the upper layer. (B) 2% H2O in the upper layer. The solid lines connect models with the same H2O contents in the lower layers (labeled at each end of the lines); the dashed lines connect models with the same depth to the lower layer. Observed fluxes at different latitudes are plotted as unconnected squares. The two most southerly points are not plotted, because they may have some contamination from the high thermal flux of the permanent CO2 cap. The observations agree well with a model that has 35 ± 15% H2O in a lower layer and 1 to 2% H2O in an upper layer that gets thinner at more poleward latitudes (from a column density of about 150 g/cm2 at –42° to about 40 g/cm2 at –77°).
The gamma-ray flux values, after background correction, have been normalized to the equivalent of 1% H2O between +30° and –30° latitude and between 90° and 210°E longitude (17). Because the H gamma rays are less sensitive to the composition at depth than the neutrons, a comparison of thermal neutron flux to H gamma-ray flux (Fig. 5) can be used to distinguish H concentrations as the upper layer gets thinner. Here the data suggest that the H2O content of the lower layer is closer to the upper range of 35 to 50% by weight.
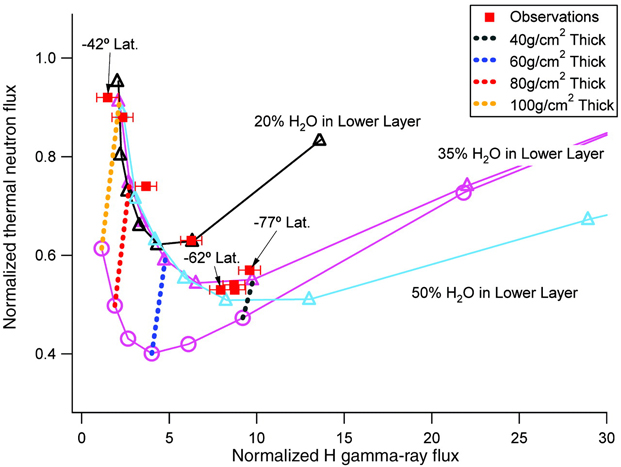
Fig. 5. Calculated and observed normalized thermal neutron flux versus normalized H gamma-ray flux. Circles, calculated models for 1% H2O in the upper layer; triangles, calculated models for 2% H2O in the upper layer. The observations are consistent with the model in Fig. 4 at lower latitudes, but they suggest the H2O content of the lower layer is closer to the upper range from 35 to 50% H2O.
A similar H-rich region is observed in the north. Like the region in the south, it begins to be visible at about 45° latitude (Fig. 2). This region presumably continues to higher latitudes, but it is obscured due to the seasonal CO2 cap beginning at about 60° latitude. The unobscured data do not go far enough toward the pole to determine whether the H2O distribution is similar to that of the south.
Some obvious sources of error need to be discussed. We have an instrument with a spatial footprint on the order of 10° (600 km) for gamma rays and epithermal neutrons, and one that is somewhat larger for thermal neutrons. The spatial resolving power is, however, sufficient to rule out a step-function change in H2O distribution. The data have been normalized because we have not yet fully validated our absolute calibration of instrument response nor have we determined the strength of the cosmic-ray excitation flux. With the current normalization, we find an implied H2O content in the driest part of Mars to be about 0.25% by weight. The Viking 1 landing site could not have much less than 1% H2O, or we would have gotten negative H2O contents at this driest point. If the Viking 1 site has more H2O, we would get an increase in the amount of H2O in the lower layer. Thus our conclusion of around 35% H2O by weight in the lower layer is robust. Lastly, we have assumed that the composition of the soil with respect to elements other than hydrogen is constant everywhere and is as found by Mars Pathfinder (14). The effect of having a different composition in the soil is biggest for elements whose variation would have the biggest effect on the total neutron macroscopic cross section. Here it is chlorine, but twofold variation in the chlorine content of the model soil had only a minor effect on our estimation of the amount of H2O in either layer. We have looked only at simple models to explain our observations. Although the data are consistent with these models, none of these solutions is unique, and the real H2O distribution is probably more complicated.
The identification of large quantities of hydrogen in the near surface is unambiguous, but the chemical form in which it is present is not clear. In the upper layer, it is likely that the H is present in the form of physically or chemically bound H2O, and this layer may be indistinguishable from the soil at mid-latitudes, where ice is not stable. For the lower layer, however, ice may be the only reasonable phase to associate with this much H for several reasons. First, the large amounts of hydrogen, 35 ± 15% H2O equivalent, is too much to be accommodated by alteration of most rock-forming minerals. Second, the stratification of H into layers with over a 10-fold difference in concentration seems hard to sustain unless a volatility comparable to that of ice is responsible. Third, the H-rich regions are only found in the colder regions, suggesting a strong volatility dependence similar to that expected for ice. Many theoretical studies have predicted regions where H2O ice should be stable on Mars (18–20). Our map of epithermal neutron flux (8) shows consistency between regions where ice is expected to be stable at a depth of 80 cm (21) and regions of low epithermal flux (Fig. 6).
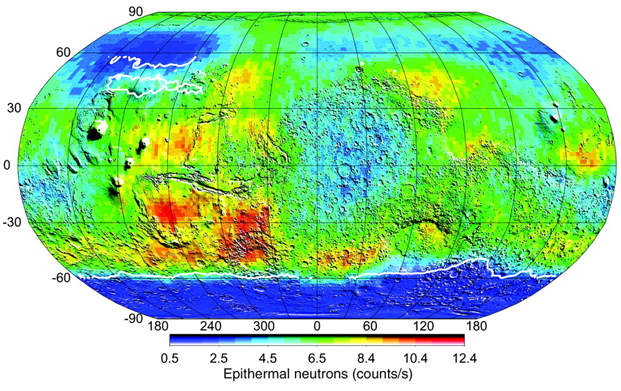
Fig. 6. Map of epithermal neutron flux from the Neutron Spectrometer. Low epithermal flux is indicative of high hydrogen concentration (8). Contours (in white) are shown of the regions where water ice is predicted to be stable at 80 cm depth (21) (no predictions were made poleward of 60° latitude because no data on thermal inertia were available). Note the correlation between regions of predicted ice stability and the low epithermal flux. The only exception is the small closed region of predicted ice stability, which is not observed in the epithermal neutron flux.
Water ice concentrations of 35 ± 15% by weight imply a subsurface material that is 60% (range from 40 to 73%) ice by volume, assuming a mean density for the non-ice component of 2.5 g/cm3. The porosity of the upper meter of the martian soil is not well known. Estimates at the Viking Lander 1 site were 1.15 ± 0.15 g/cm3 for drift material and 1.6 ± 0.4 g/cm3 for blocky material (22). Assuming silicate grain densities of 2.5 g/cm3 and absence of ice in the pores at the Viking 1 site, these inferred bulk densities yield porosities for these materials of 54 ± 6% and 36 ± 16%, respectively. The lower end of our inferred subsurface ice concentrations is consistent with these porosities if the pores are filled, but it is difficult to imagine a soil with sufficient porosity to accommodate an ice content toward the upper end of our inferred range.
It is important to note that we find a strong subsurface hydrogen signal on Mars essentially everywhere that ice is expected to be stable and where our signal is not obscured by CO2. The total pore space in the regolith has been estimated to be sufficient to contain ice equivalent to a global water layer 0.5 to 1.5 km deep (23). Our results, of course, do not reveal anything about whether or not ice is present in the enormous volume of regolith that lies below the roughly 1 m depth to which the gamma and neutron techniques can sense. However, they certainly are consistent with the view that the subsurface regolith may be a substantial reservoir for martian water.
REFERENCES
1. M. H. Carr, Water on Mars (Oxford Univ. Press, New York, 1996).
2. V. R. Baker, Nature 412, 228 (2001).
3. H. H. Kieffer, S. C. Chase Jr.., T. Z. Martin, E. D. Miner, F. D. Palluconi, Science 194, 1341 (1976).
4. M. C. Malin, K. S. Edgett, Science 288, 2330 (2000).
5. J. F. Mustard, C. D. Cooper, M. K. Rifkin, Nature 412, 411 (2001).
6. W. V. Boynton et al., J. Geophys. Res. 97, 7681 (1992).
7. W. V. Boynton et al., in preparation.
8. W. Feldman et al., Science 297, 75 (2002); published online 30 May 2002 (10.1126/science.1073541).
9. I. Mitrofanov et al., Science 297, 78 (2002); published online 30 May 2002 (10.1126/science.1073616).
10. W. V. Boynton, L. G. Evans, R. C. Reedy, J. I. Trombka, in Remote Geochemical Analysis: Element and Mineralogical Composition, C. M. Pieters, P. A. J. Englert, Eds. (Cambridge Univ. Press, New York, 1993), chap. 17.
11. W. C. Feldman, W. V. Boynton, D. M. Drake, in Remote Geochemical Analysis: Element and Mineralogical Composition, C. M. Pieters, P. A. J. Englert, Eds. (Cambridge Univ. Press, New York, 1993), chap. 10.
12. T. H. Prettyman et al., Lunar Planet. Sci. Conf. XXXIII (abstr. 2012) (2002).
13. L. S. Waters, Ed., MCNPX User's Guide(document LA-UR-99-6058) (Los Alamos National Laboratory, Los Alamos, NM, 1999).
14. H. Wänke, J. Brückner, G. Dreibus, R. Rieder, I. Ryabchikov, Space Sci. Rev. 96, 317 (2001).
15. K. Biemann et al., J. Geophys. Res. 82, 4641 (1977).
16. The exact H2O content of the Viking soil does not have a strong influence on the conclusions of this work other than to change the composition of the upper layer in direct proportion to the Viking 1 H2O content. The Viking 2 site was in a region far enough north that it appears to have abundant near-surface ice and, thus, cannot be used for normalization.
17. The statistics of the H gamma-ray line are not adequate to normalize to just one location on Mars, as was done for the neutron fluxes. The conclusions of this work are not sensitively dependent on the H gamma-ray normalization.
18. R. B. Leighton, B. C. Murray, Science 153, 136 (1966).
19. C. B. Farmer, P. E. Doms, J. Geophys. Res. 84, 2881 (1979).
20. D. A. Paige, K. D. Keegan, J. Geophys. Res. 99, 26013 (1994).
21. M. T. Mellon, B. M. Jakosky, J. Geophys. Res. 98, 3345 (1993).
22. H. J. Moore, B. M. Jakosky, Icarus 81, 164 (1989).
23. S. W. Squyres, S. M. Clifford, R. O. Kuzmin, J. R. Zimbelman, F. M. Costard, in Mars, H. H. Kieffer, B. M. Jakosky, C. W. Snyder, M. S. Matthews, Eds. (Univ. of Arizona Press, Tucson, 1992), chap. 16.
24. We confirmed that the northern region is nearly opaque to gamma rays by noting that the signal from the radioactive element potassium in this region agreed with the signal determined during cruise to Mars within 4 ± 2%.
25. The authors would like to thank J. Astier, A. Evers, K. Crombie , G. Davidson, H. Enos, C. Fellows, M. Fitzgibbon, J. Hambleton, K. Harshman, D. Hill, K. Kerry, G. McArthur, C. Turner, M. Ward, and M. Williams of the University of Arizona for the hard work to design, build, test, calibrate, and operate the GRS. We also wish to thank the efforts of the Mars Odyssey project personnel at both the Jet Propulsion Laboratory and Lockheed Martin Astronautics for getting us safely to Mars.
