")
")
Maps of Subsurface Hydrogen from the High Energy Neutron Detector, Mars Odyssey
I. Mitrofanov1, D. Anfimov1, A. Kozyrev1, M. Litvak1, A. Sanin1, V. Tret'yakov1, A. Krylov2, V. Shvetsov2, W. Boynton3, C. Shinohara3, D. Hamara3 and R. S. Saunders4
1Institute for Space Research, Moscow 117997, Russia.
2 Joint Institute for Nuclear Research, Dubna 141980, Russia.
3University of Arizona, Tucson, AZ 85721, USA.
4Jet Propulsion Laboratory, Pasadena, CA 91109, USA.
Abstract - After 55 days of mapping by the High Energy Neutron Detector onboard Mars Odyssey, we found deficits of high-energy neutrons in the southern highlands and northern lowlands of Mars. These deficits indicate that hydrogen is concentrated in the subsurface. Modeling suggests that water ice–rich layers that are tens of centimeters in thickness provide one possible fit to the data.
DOI: 10.1126/science.1073616 - http://www.sciencemag.org/content/297/5578/78
Some gullies on the surface of Mars have been attributed to recent water seepage and surface runoffs (1). To understand the hydrological processes on Mars that form surface features such as the gullies, we need to identify where water might exist. There is a small amount, column density ∼10−3 g/cm2, of water vapor in the atmosphere (2), and surface water ice is present only at the polar caps of Mars (3–5). Measurements of secondary neutrons produced by cosmic rays from Mars provide a direct test for hydrogen-bearing species. A deficit of high-energy neutrons at some regions on Mars may indicate the presence of water in the subsurface, because neutrons become moderated down to thermal energies in the presence of hydrogen.
Because Mars lacks a magnetic field and has a thin atmosphere, cosmic rays propagate to and interact with the surface. As a result of the cosmic ray bombardment, a large number of secondary neutrons are produced within a subsurface layer 1 to 2 m thick (6–8). These neutrons interact with nuclei of atoms of the subsurface material, producing emission of gamma-ray lines (8). Each chemical element has a unique set of these lines, so that gamma-ray spectroscopy can identify the composition of the martian subsurface.
Photons of nuclear gamma-ray lines are emitted by inelastic scattering reactions of high-energy neutrons and by capture reactions of low-energy neutrons. Therefore, the intensity of gamma-ray lines depends on the elemental compositions of the subsurface and on the spectrum and flux of neutrons. Thus, knowledge of the spectral density of neutrons is a necessary condition for determination of the elemental abundance by the method of gamma-ray spectroscopy. However, the energy spectrum of leakage neutrons also depends on the composition of subsurface material. A neutron with mass m loses a small fraction of energy ∼ m/(M +m) in the collision with a heavy nucleus with massM, but the fraction is about ½ when it collides with nuclei of hydrogen with the same mass m. Even a few weight percent of hydrogen decreases the leakage flux of epithermal and high-energy neutrons and increases the flux of thermal neutrons (6–8).
The High Energy Neutron Detector (HEND) is part of the Gamma-Ray Spectrometer (GRS) suite (9) on the Mars Odyssey mission (10). The GRS suite also includes the Germanium Sensor Head and the Neutron Spectrometer. These instruments are mapping Mars to determine the composition of the subsurface layer. HEND began mapping on 18 February 2002, when Odyssey was inserted into a circular polar orbit with a period of ∼2 hours at an altitude of ∼390 to 450 km. The spacecraft has a stable orientation with respect to the zenith-nadir vector and the plane of the orbit, and therefore variations in measured neutron flux along the orbit correspond to real differences in neutron emission at different points on the planet.
The spacecraft is exposed to galactic cosmic rays. Charged energetic particles of cosmic rays produce secondary neutrons and gamma rays inside Odyssey. To make an accurate map of neutrons from Mars, we subtracted the local Odyssey background from the measured flux from the planet (11). During the aerobraking stage, the original elliptical orbit of Odyssey was gradually transformed into a circular orbit. HEND was operating during the aerobraking stage from 18 November until 19 December 2001. Data accumulated during the shrinking elliptical orbits allowed us to build up a model of the local Odyssey background attributable to cosmic rays. This background is subtracted from the data obtained during the mapping stage of the mission. Other background fluxes (12) need to be considered after Mars Odyssey has completed additional mapping.
Two effects due to the martian atmosphere are also not taken into account in the present mapping. The first effect produces the natural collimation of detected neutrons, because particles propagating with larger inclinations to the nadir direction are more scattered or absorbed as a result of their larger pass in the atmosphere. We do not take this effect into account in the present maps, but we attribute all detected counts directly to the point with spacecraft coordinates.
Another effect is associated with variations in measured neutron flux along the orbit, attributed to the variable absorbing thickness of the martian atmosphere above areas with different elevations. However, the martian atmosphere is thin, and the flux of neutrons at the top cannot be affected considerably by variable absorption. We know from numerical calculations (8) that the flux of fast neutrons varies by about ±15% around a mean value, when the column density of the atmosphere changes from 15 g/cm2 down to 5 g/cm2 and up to 25 g/cm2. In the present maps, we find much larger changes in neutron flux that cannot be explained by such small deviations.
The leakage flux of neutrons from Mars decreases with increasing neutron energy (1–3). The three sensors of HEND with 3He proportional counters have surrounding moderators, each with a different thickness, inside the cadmium enclosure, which allows the mapping of the leakage flux at energies 0.4 eV to 1 keV, 0.4 eV to 100 keV, and 10 eV to 1 MeV. Here we present the map from the counter with the medium moderator; this counter best represents the epithermal energy range, and it provides the highest significance of accumulated counts above the background estimation.
The map of martian epithermal neutrons with energies 0.4 eV to 100 keV (Fig. 1) shows large variations in the neutron leakage flux. The maximal count rate Feth (max) = 0.26 counts/s is observed at Solis Planum around the point with coordinates 270°E, 30°S. A minimum count rate of about 0.04 counts/s was detected above the large province in the southern hemisphere (south of 60°S latitude) with an area Seth(S)≈ 107 km2. The corresponding deficit of epithermal neutrons in the southern province was δeth(S) =Feth(S)/Feth(max)= 0.17 ± 0.04. According to the Mars Observer Laser Altimeter (MOLA) map of martian topography, the average elevation of this province at latitude 70°S is about +1 to +2 km (13). Another region of low flux, but with a smaller Seth(N) ≈ 5 × 10⁶ km2, was observed in the northern hemisphere. It is a broad arc along latitude 60°N, which extends from north of Alba Patera at 290°E to Elysium at 150°E (Fig. 1). It has a deficit of epithermal neutrons δeth(N)=Feth(N)/Feth(max)= 0.29 ± 0.04 and elevation about –2 to –3 km (6).Figure 1 also shows two smaller regions in the equatorial zone with deficits of epithermal neutrons. One of them is centered at 30°E and has a deficit δeth(30°E) =Feth(30°E)/Feth(max)= 0.45 ± 0.04, and another is around 200°E with a deficit δeth(200°E) =Feth(200°E)/Feth(max)= 0.48 ± 0.04.
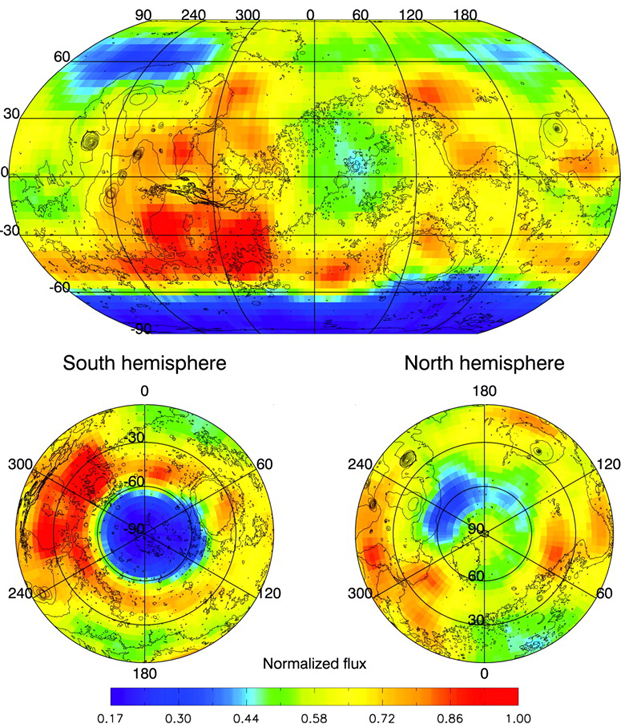
Fig. 1. The initial map of orbital measurements of martian epithermal neutrons by HEND with energies at 0.4 eV to 100 keV for the first 55 days of mapping. Pixels with sizes 4° × 4° are smoothed with the scale of 10°. The size of 4° at the equator corresponds to a linear scale of about 240 km. The contours of MOLA topography (12) are shown for comparison. The map is normalized to 1 at the pixel with the highest count rate, 0.26 counts/s in Solis Planum (270°E, 30°S). The minimal statistical significance of any pixel is above 5σ of background fluctuations; minimal time exposure for pixels is 600 s.
The northern arc-like region has about 3 to 5 km greater atmospheric thickness than the southern province above 60°S, but the northern region has a much smaller deficit of neutron flux relative to the southern province. Therefore, we cannot attribute larger deficits of neutron flux to more absorption in a thicker atmosphere. The atmospheric absorption effect for regions at a similar season of the martian year can be tested by comparing two areas at the same latitude (10°N) and at different longitudes (30°E and 295°E). They have similar elevations around 0 km (12) but manifest different count rates: ∼0.1 counts/s and ∼0.2 counts/s, respectively (Fig. 1). Hence, variable atmospheric thickness is not responsible for observed variations of neutron flux at the top of the atmosphere.
The HEND map of epithermal neutrons is similar to the map produced by the Neutron Spectrometer in the same energy range (14). The measurements by the Germanium Sensor Head also show evidence for subsurface hydrogen in this southern province, because the averaged spectrum over this area contains a 2.2-MeV line (15). This nuclear line emission results from the capture reaction of thermal neutrons by hydrogen nuclei with the creation of an excited deuterium nucleus, which decays by emitting 2.2-MeV photons.
High-energy neutrons were measured by the HEND Stylbene scintillation sensor in 16 logarithmic channels from 850 keV to 15 MeV with a peak efficiency around 3 MeV. A map of neutron flux from the energy range 3.4 to 7.3 MeV (Fig. 2) was normalized to the maximal peak flux value FMeV(max) = 0.15 counts/s, which was detected at the same region of Solis Planum as for the epithermal neutrons. We consider the flux of neutrons from this region of Solis Planum as the reference flux for measuring deficits at different points on Mars.
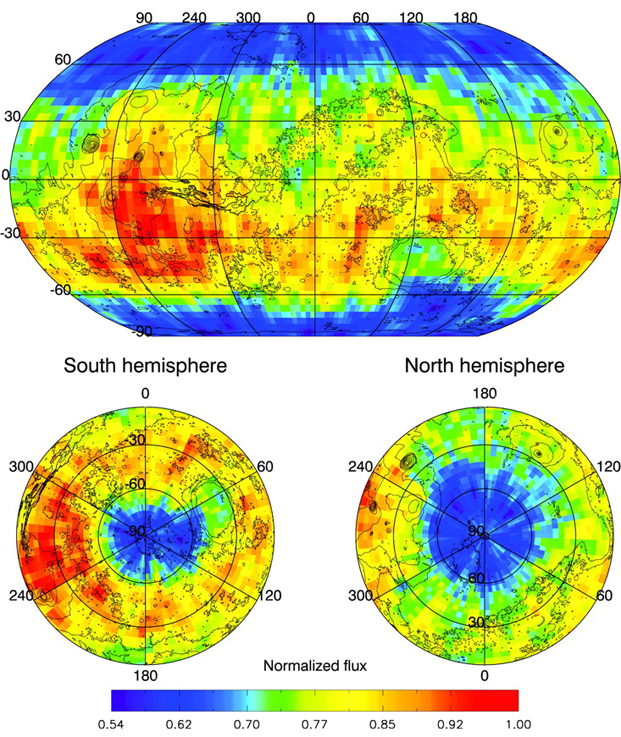
Fig. 2. The initial map of orbital measurements of martian high-energy (fast) neutrons by HEND with energies 3.4 to 7.3 MeV for the first 55 days of mapping. Pixels with sizes 4° × 4° are smoothed with the scale of 10°. The size of 4° at the equator corresponds to a linear scale of about 240 km. The contours of MOLA topography (12) are shown for comparison. The map is normalized to 1 at the pixel with the highest count rate, 0.15 counts/s in Solis Planum (270°E, 30°S). The minimal statistical significance of any pixel is above 5σ of background fluctuations; minimal time exposure for pixels is 600 s.
The map of neutrons at 3.4 to 7.3 MeV (Fig. 2) has two differences from the map of epithermal neutrons (Fig. 1). The first difference is that the neutron map at MeV range shows a larger region of lower flux in the north and a smaller one in the south. They correspond to areas SMeV(N) ≈ 107km2 and SMeV(S) ≈ 4 × 10⁶ km2 and deficits δMeV(N) =FMeV(N)/FMeV(max)= 0.57 ± 0.11 and δMeV(S) =FMeV(S)/FMeV(max)= 0.54 ± 0.09, respectively. The model calculations of leakage neutrons indicate (1) that these deficits may correspond to about 5% by weight of water in a homogeneous subsurface layer. This value is larger than the 0.1% by weight of absorbed water estimated to be in the soil as a result of atmospheric humidity (16). The higher content may be associated with chemically bound water in the subsurface.
The map of neutrons at 3.4 to 7.3 MeV agrees with the dichotomy boundary of martian topography (12). The low flux of 3-MeV neutrons in the north cannot be explained by the northern winter CO2 frost, because it does not change the leakage flux at MeV energies (6). Thus, Mars has two large provinces—one in the northern lowlands and the other in the southern highlands—with an uppermost subsurface layer containing hydrogen, and this hydrogen may be bound in water ice. A global mechanism of water transport for the surface and the subsurface may be needed to explain the presence of subsurface water ice at low elevation in the north and high elevation in the south [e.g., see (17)].
Another difference between the two maps (Figs. 1 and 2) is that the southern province has a much lower flux of epithermal neutrons relative to the flux for neutrons at 3.4 to 7.3 MeV range. The ratio between the observed deficits is η = δeth(S)δMeV(S)= 0.31. The model of a homogeneous layer indicates that the water-produced deficit of neutrons is about the same at epithermal and 3-MeV energy ranges (6). Neutrons at MeV energies leak from shallower depths than do epithermal neutrons (8). Therefore, the stronger decrease of epithermal particles in the southern province may result from a layered structure of the subsurface, in which a dryer upper layer of soil with about 5% water (which contributes mainly to MeV neutron emission) covers a wetter, lower layer with a higher percentage of water ice (which makes the main contribution to epithermal neutron emission).
To illustrate this possibility, we produced a numerical model of the layered subsurface, which describes the additional lower flux of epithermal neutron leakage. An icy layer with thickness h0 = 20 cm was positioned in the subsurface below a layer of dryer soil with 5% water and a variable thicknessh. The icy layer produces additional deficits of leakage neutrons δeth(S)(h) and δMeV(S)(h) in comparison with values δeth(S)(∞) and δMeV(S)(∞), which correspond to the upper layer of soil only, when h = ∞. The additional deficit disappears when thickness h increases (Fig. 3). The observed ratio η = δeth(S)/δMeV(S)= 0.31 is consistent with the thickness of an upper layer of soil about 10 to 60 cm above the top of an icy layer (Fig. 3). This model is just one of many that is consistent with these observations [see also (15)]; however, h0 = 20 cm is close to the minimal thickness of a water ice layer that may fit the observations.
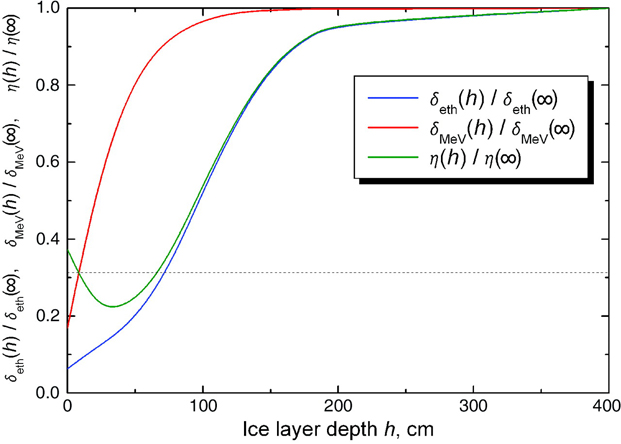
Fig. 3. Calculated dependence of deficits δeth, δMeV, and their ratio η = δeth/δMeV on the thickness of an uppermost dry layer above a layer of water ice with a thickness of 20 cm. The dashed line indicates the value of the ratio η = δeth/δMeV = 0.31, observed for the southern province of Mars.
REFERENCES
1. M. C. Malin, K. S. Edgett, Science 288, 2330 (2000).
2. B. M. Jakosky, R. J. Phillips, Nature 412, 237 (2001).
3. H. H. Kieffer et al., Science 194, 1341 (1976).
4. M. T. Zuber et al., Science 282, 2053 (1998).
5. D. E. Smith et al., Science 284, 1495 (1999).
6. D. M. Drake, W. C. Feldman, B. M. Jakosky, Proc. Lunar Planet. Sci. Conf. 17, 186D (1986).
7. W. C. Feldman et al., J. Geophys. Res. 98, 20855 (1993).
8. J. Masarik, R. J. Reedy, J. Geophys. Res. 101, 18891 (1996).
9. W. V. Boynton et al., in preparation.
10. R. S. Saunders, AGU Fall Meeting 2001, abstract #P41A-08 (American Geophysical Union, Washington, DC, 2001).
11. The circular orbit of the mapping stage does not allow us to distinguish the local background from the spacecraft from the constant component of the martian neutron emission. During the elliptical orbits with period about 10 hours, the solid angle of Mars ΔΩ varied from 4.8 steradians in periapsise down to 0.1 steradian in apoapsise. The local background due to galactic cosmic rays depends on the fraction of the open sky (4π – ΔΩ)/4π, whereas the signal from Mars is proportional to ΔΩ.
12. In addition to the cosmic ray–induced local background, Odyssey affects the background signal by scattering and absorption of neutrons from Mars. This effect will be removed when present maps of counts of neutrons are transformed into corrected maps of neutron emission of the surface of Mars. This effect may not produce any coordinate-dependent variations of detected counts on the orbit, but it should be taken into account for evaluation of absolute values of surface flux.
13. D. E. Smith et al., J. Geophys. Res. 106, 23689 (2001).
14. W. C. Feldman et al., Science 297, 75 (2002); published online 30 May 2002 (10.1126/science.1073541).
15. W. V. Boynton et al., Science 297, 81 (2002); published online 30 May 2002 (10.1126/science.1073722).
16. D. Möhlman, Proceedings of Workshop, Potsdam, Germany, 17 to 19 April 2002.
17. V. R. Baker, Nature 412, 228 (2001).
18.We thank the Odyssey project team, which made these space measurements possible, as well as the anonymous reviewers for useful questions and comments.
