")
")
Search for Water in Martian Soil Using Global Neutron Mapping by the Russian HEND Instrument Onboard the US 2001 Mars Odyssey Spacecraft
I. G. Mitrofanov1, M. L. Litvak1, A. S. Kozyrev1, A. B. Sanin1, V. I. Tret'yakov1, W. V. Boynton2, C. Shinohara2, D. Hamara2, S. Saunders3, and D. M. Drake4
1 Space Research Institute, Russian Academy of Sciences, Profsoyuznaya 84/32, Moscow, 117997 Russia
2 Lunar and Planetary Laboratory, University of Arizona, Tucson, AZ 85721, USA
3 Jet Propulsion Laboratory, Pasadena, CA 91109, USA
4Los Alamos National Laboratory, Los Alamos, NM 87545, USA
Abstract - We present the first results of the global neutron mapping of Mars by the Russian High-Energy Neutron Detector (HEND) onboard the US 2001 Mars Odyssey spacecraft. Global neutron maps of Mars in various spectral ranges allow the content of water ice and adsorbed and bound water in a near-surface layer of the planet 1 to 2 m in thickness to be estimated. Huge regions of permafrost with a high (several tens of percent by weight) content of water ice are shown to be present in the north and the south of Mars. The continuous observations of Mars for 12 months, from February 18, 2002, through February 8, 2003, are indicative of significant seasonal variations on Mars where the transition from northern winter to northern summer occurred.
DOI: 10.1023/A:1026018811877 - http://www.springerlink.com/content/h2455m277541m250/
-------------------------------------------------------------------------------------------------------------------------------------------------
THE CONCEPT OF THE HEND AND ITS CHARACTERISTICS
CONDITIONS FOR MAPPING THE ORBITAL NEUTRON MEASUREMENTS OF MARS
A CALCULATED DEPENDENCE OF THE NEUTRON FLUX ON THE WATER CONTENT
IN THE UPPER SURFACE LAYER OF MARS
THE MAPS OF ORBITAL MEASUREMENTS OF THE NEUTRON FLUX FROM
THE EXPOSED (SUMMER) MARTIAN SURFACE
THE NORTHERN AND SOUTHERN PERMAFROST REGIONS
-------------------------------------------------------------------------------------------------------------------------------------------------The NASA 2001 Mars Odyssey interplanetary spacecraft, which was launched into space from Cape Canaveral on April 7, 2001, was successfully placed in an orbit around Mars on October 24, 2001. The scientific payload of this spacecraft comprises a gamma-ray spectrometer to study the Martian surface composition. The spectrometer includes a gamma-ray detector, a neutron spectrometer, and the Russian High-Energy Neutron Detector (HEND).
The Origin of Martian Neutrons. The column density of the Martian atmosphere is only about 20 g/cm2, and Mars has no global magnetic field. Therefore, Galactic cosmic rays almost freely penetrate the Martian surface and produce the so-called secondary neutrons at a depth of 1 to 2 m. As the neutrons emerge on the surface, they interact with nuclei of the main material of the planet and lose their energy. The pattern of these interactions depends on the neutron energy. If the neutrons are fast, with energies of about several MeV or higher, then inelastic scattering processes, where the nucleus is excited, emits gamma-ray photons of nuclear transitions, and returns to the ground state, dominate in the collisions. When the neutrons decelerate to energies of about several eV, nuclear capture reactions, in which new excited nuclei that also emit nuclear transition lines when passing to the ground state are formed, dominate in the interactions.
Many neutrons are completely thermalized to form a thermal component of the emergent flux. Some of the neutrons leave the near-surface layer before their deceleration to thermal energies. These neutrons form a power-law component of the fast neutron flux. The ratio of the fluxes of fast and thermal neutrons depends on the nuclear composition of the near-surface material and, in particular, on the presence of hydrogen nuclei in it.
The Degree of Neutron Thermalization as an Indication of Water. The presence of hydrogen in the material significantly increases the moderation and thermalization efficiency of the original fast neutrons. Whereas neutrons of mass M in collisions with heavy nuclei of mass M lose only a small fraction of their energy (about m /(M + m )), the neutron energy each time decreases by a factor of approximately 2 when the neutrons collide with protons (i.e., with hydrogen nuclei of the same mass m as that of neutrons). Therefore, only about 30 collisions with hydrogen nuclei are enough for an original neutron with energy of 10 MeV to decelerate to thermal energies of about 0.01 eV.
Given the neutron formation and thermalization in a 1 to 2-m-thick near-surface layer of Mars under the effect of cosmic rays with the excitation of nuclear emission lines, a nuclear-physical method of studying the nuclear composition of the Martian surface and exploring areas with enhanced water content was suggested (Drake et al., 1988; Masarik and Reedy, 1996; Feldman et al., 1993). Indeed, the "forest" of nuclear emission lines closely corresponds to the set of nuclei of the main rock-forming elements. In areas with enhanced water content, a dark region will be observed on the brightness map of high-energy neutrons, while on the brightness map of thermal neutrons this region must be brighter.
The HEND is part of the GRS (Gamma-Ray Spectrometer) instrumentation. This multipurpose experiment also includes a detector made of particularly pure germanium, which records gamma-ray emission with a very high spectral resolution, and a neutron spectrometer to record thermal and fast neutrons (Boynton, 2003). The first observations of the Martian nuclear radiation showed that the GRS instrumentation is completely suited to the set objectives. Below, we present the first results of our search for near-surface water using HEND neutron measurements.
Water on Mars. The urgency of exploring Martian regions with high near-surface water content stems from the fact that the US Martian Orbital Camera (MOC) onboard the NASA Mars Global Surveyor spacecraft has recently detected relatively young relief structures on Mars that could be formed by water flows on the surface. These relief structures are similar to gullies and canyons on the Earth, which are formed by water flows (Malin and Edgett, 2000). They are relatively young compared to the relief of the surrounding surface. Malin and Edgett (2000) and Mellon and Phillips (2001) suggested that reservoirs of water covered with a layer of ice are located in some of the areas beneath the Martian surface. The water of these reservoirs can sporadically flow to the surface through local faults or fractures to form riverbeds and scours.
Presently, the fact that a polar cap of water ice is located at the north pole of Mars is believed to have been firmly established. The polar cap at the south pole probably also contains water ice covered by frozen carbon dioxide deposits (Christensen et al., 2001a). In addition, clouds of ice particles are observed in the Martian atmosphere. However, it can hardly be assumed that the polar caps and the clouds of frozen water absorbed all of the water resources of the planet. Gullies and canyons at the boundaries of lowlands and highlands were considered as evidence of subsurface water at temperate latitudes.
It is well known that water adsorbed in the form of a thin molecular layer on the surfaces of individual particles may constitute up to 1% of the soil mass (Mohlmann, 2002). Chemically bound water in the crystal lattice of minerals may constitute up to 5–10% of the soil mass (Basilevsky et al., 2003). If the water content in the surface layer exceeds 10% by mass, then we should assume the presence of free water ice in the soil. This soil may be called permafrost. If the mass fraction of ice is 10–30%, then it may be considered to fill the free space (pores) between solid particles. This ice could accumulate in the near-surface layer of permafrost from the atmosphere under the influence of cyclic daily and seasonal variations. If the mass fraction of ice in the near-surface layer is significantly higher than 30%, then the surface formation processes for which water ice in the form of a layered or homogeneous medium form one of the main components of the soil structure are required for the formation of such soil.
One might expect the global mapping of water on the Martian surface to be a key stage for elucidating the model of its geologic evolution both on the lifetime scale of the planet and at the current geologic epoch. Neutron mapping of Mars allows us to estimate the average amount of near-surface water in a 1 to 2-mthick layer beneath the surface and to distinguish regions with the dominance of various forms of water by using other measurements. Thus, we will be able to determine the surface formation mechanisms in various regions, estimate the total amount of water on Mars at present, and trace the hydrologic evolution of the planet in the past. Of particular interest is to directly estimate the content of near-surface water in some special Martian regions, for which other observations suggested their possible relationship to hydrologic processes on Mars (see Basilevsky et al., 2003).
It should also be noted that the exploration of nearsurface water is of particular interest in choosing landing sites of future missions to directly study the waterrich soil. Obviously, evidence of life or paleolife should be searched for in an environment with high water content. The exploration of water deposits is also of great interest for the technological maintenance of a future landing of humans on Mars.
THE CONCEPT OF THE HEND AND ITS CHARACTERISTICS
The physical concept of the HEND was chosen to cover the widest neutron energy range from 0.4 eV to 15 MeV with a sensitivity high enough for the results obtained to be unequivocally interpreted under conditions of limited weight (up to 4 kg).
The three HEND detectors (SD, MD, and LD) were constructed from 3He neutron proportional counters surrounded by different polyethylene moderator layers (Figs. 1 and 2). These counters record thermal neutrons in 3He capture reactions to produce an α particle and a proton. Industrial LND 2517 counters were used in the instrument.
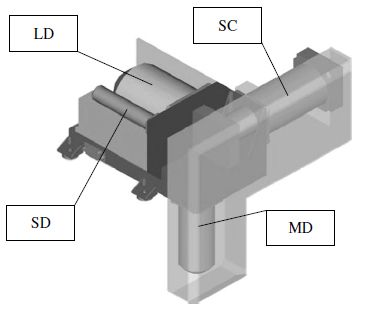
Fig. 1. A schematic view of the HEND with the SD, MD, and LD detectors based on 3He proportional counters and the Sc/IN stilbene scintillation detector with the Sc/OUT detector for a CsI anticoincidence shield.
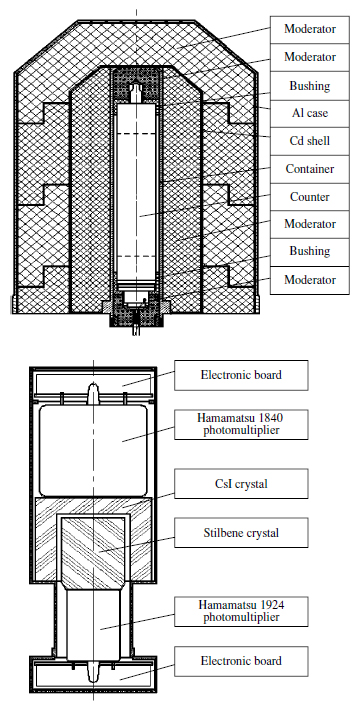
Fig. 2. A schematic view of the LD detector (upper panel) and the scintillation unit (lower panel).
When external neutrons fall on the detectors, they decelerate in polyethylene to thermal energies and are recorded in the proportional counters. The moderation efficiency in polyethylene depends on its thickness. Therefore, the LD detector with the thickest moderator layer (about 30 mm) is most sensitive to neutrons with energies 10 eV–1 MeV. The MD detector with a 14-mm-thick moderator best records neutrons with energies 10 eV–100 keV. The detector with the thinnest (3 mm) moderator records mostly neutrons with energies from the cadmium threshold of 0.4 eV to 1 keV. Thus, the set of three detectors (SD, MD, and LD) covers a wide range of neutron energies, from 0.4 eV to 1 MeV (Fig. 3).
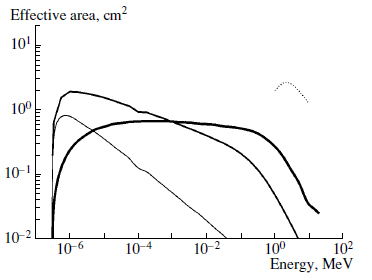
Fig. 3. Calculated curves for the effective HEND detector area.
An IN/SC detector based on an organic stilbene scintillator is used in the HEND to record neutrons with energies above 1 MeV (Fig. 2, the lower part). This scintillator records high-energy neutrons by flashes of light from recoil protons knocked out of the organic crystal lattice by neutrons. However, under space conditions, stilbene will record not only recoil protons from neutrons but also primary protons from cosmic rays. In addition, cosmic-ray electrons and secondary electrons produced by gamma-ray photons will be recorded in stilbene.
Proton pulses were separated from electron pulses by a specially designed electronic separation circuit based on analysis of the signal shape from optical flashes, which significantly differ for these particles. The HEND tests showed that the circuit effectively separates proton pulses from electron pulses. The possible erroneous recording of the electron signal as a proton signal has a probability of 5×10⁻⁴.
Recoil protons were separated from primary cosmic- ray protons by an anticoincidence shield using an additional OUT/SC ScI scintillation detector. It surrounds the IN/SC stilbene detector from the open sky but leaves open the directions of the Martian surface. When a charged particle passes through the outer OUT/SC detector, a veto logical signal is generated in the instrument, which forbids the recording of the pulse from the inner IN/SC detector at this time.
The HEND was designed in such a way that all of its four neutron detectors were separated and turned relative to each other as much as possible, while having the best fields of view under the spacecraft flight conditions in a circular polar orbit with an altitude of about 400 km. The mapping stage began on February 18, 2002 and, according to the scenario of the mission, must last for about 900 days. Since the spacecraft was successfully placed in a working orbit, there was a large reserve of fuel that allows the operation of the spacecraft in the Martian orbit to be continued for another several years.
CONDITIONS FOR MAPPING THE ORBITAL NEUTRON MEASUREMENTS OF MARS
The Maps of Orbital Measurements. The goal of the HEND experiment is a global mapping of neutrons from the Martian surface in various energy ranges: from epithermal neutrons with energies above 1 eV to high-energy (several MeV) neutrons. Even the first enough to perform the formulated task: the orbital count rate of neutrons from Mars significantly exceeds the local spacecraft background and the sky background. However, orbital measurements reflect the neutron flux density above the Martian atmosphere, and they must be subjected to a complex processing procedure to transform them to a surface neutron map. This procedure must allow for the angular and spectral dependences of the HEND detector response functions, the composition and spatial distribution of the spacecraft material, the local atmospheric thickness, the elevation, and the neutron radiation pattern on the surface. Presently, this procedure is at the final stage of development.
Allowance for the Background. The neutron maps of Mars presented below characterize the spatial neutron- flux variations above the atmosphere at an altitude of the 2001 Mars Odyssey orbit of about 400 km. These maps do not show the absolute surface neutron fluxes, but they faithfully reflect the relative flux variability in various Martian regions. The point is that the Martian atmosphere is virtually transparent for neutrons. Numerical calculations indicate that variations in the atmospheric column density between 5 and 25 g/cm2 about its mean of 15 g/cm2 can change the emergent neutron flux only by ±15% relative to the mean. Since the orbital measurements are indicative of much larger neutron-flux variations above various areas of the Martian surface (see below), the atmospheric effects may be ignored at this stage.
Clearly, the orbital measurements also contain the contribution from the local spacecraft background. The point is that the spacecraft, as well as any massive body in space, produces secondary nuclear radiation under the influence of cosmic rays. In the maps presented below, the local spacecraft background was eliminated, to a first approximation. This background was measured during the flight and aerobraking of 2001 Mars Odyssey, when the spacecraft moved in interplanetary and highly elongated elliptical orbits, respectively. As the spacecraft approached Mars, the planet blocked part of the cosmic-ray flux, and the local spacecraft background from the direct influence of cosmic rays decreased accordingly. The background far from Mars multiplied by 1 – ΔΩ/4π, where Ω is the solid angle of Mars from the point at the orbit, was taken as an estimate of the local orbital background.
Obviously, the local spacecraft background also contains the backscattering component produced by the neutron flux from Mars. This component is weak and will be taken into account at the next stage of the passage from the map of orbital measurements to a surface brightness map. It can be included in the HEND response function as the effect of the secondary scattering of neutrons from Mars in the HEND and spacecraft material.
The Spatial Resolution. The maps presented below were constructed by breaking down the sphere of orbital motion into pixels whose angular sizes are 1° in latitude and 1° in longitude, with the additional smoothing in a 5°×5° window. These pixels are in the shape of a 60-by-60 km square on the equator, and their linear sizes in longitude decrease poleward proportionally to the cosine of the latitude. The total accumulated number of neutron counts and the total exposure time during which the spacecraft was within a given pixel are associated with each pixel on the map. The ratio of the accumulated number of counts to the exposure time is equal to the neutron count rate for a given pixel.
The linear compression of the pixels with increasing latitude decreases the time of a single exposure during the orbital flight of the spacecraft through the pixel. However, this effect is offset by the increase in the frequency of the spacecraft flight within each pixel. Therefore, for a uniform neutron flux from the surface, approximately equal count statistics will be accumulated in all pixels of the map in equal exposure times.
The spatial resolution for surface neutron-flux variability measurements is determined by the physical conditions for recording the neutron flux that emerges at an altitude of the spacecraft orbit of about 400 km through the atmosphere rather than by the sizes of the selected pixels. The atmospheric attenuation of the neutron flux significantly depends not only on the angle between the velocity vector and the zenith direction but also on the neutron energy. The first results of numerical simulations indicate that the attenuation of fast neutrons is much larger than that of epithermal neutrons. As regards the spatial resolution, preliminary estimates show that the surface area from which neutron radiation is collected can be 10°×10°, or about 600 km in one linear size (Prettyman et al., 2003). Accordingly, a higher spatial resolution can be achieved only by using a model-dependent method, which is now being developed.
Therefore, although the maps of orbital measurements presented below have a spatial resolution of 1°×1°, they yield only an average estimate of the water content with an equatorial spatial resolution of several tens of kilometers, in which neutron radiation from neighboring pixels is mixed. Clearly, the water content in local regions of smaller sizes can be much lower or much higher than this mean value. In general, based on orbital neutron measurements alone, we cannot distinguish the cases with uniform water content in the observed region from the case where local regions with a very high content of water ice are embedded in the region of dry soil. Similarly, based on orbital measurements, we cannot unambiguously restore the water distribution in the depth of the observed 1 to 2-m-thick layer. A model of the most likely soil water distribution can be constructed from the measurements of neutrons with various energies, but these data are also not enough to unambiguously determine the water distribution in depth. Therefore, when discussing our results, we should distinguish the direct measurements and the model-dependent estimates.
In our view, these difficulties in interpreting the data do not reduce the interest in discussing the first results of the orbital measurements of neutrons from Mars. First, the variations in the neutron flux from various Martian surface regions were found to be great, being about an order of magnitude. Therefore, the orbital measurements are accurate enough to conclude that large amounts of water are present in the Martian surface. Second, conclusions about the soil composition and moisture are drawn from the simultaneous analysis of the data from all of the three GRS instruments onboard 2001 Mars Odyssey, which also increases their reliability. Third, the neutron measurements should be analyzed by taking into account the entire set of geophysical and geochemical observational data for Mars, which also ensures a high reliability of the results obtained.
A CALCULATED DEPENDENCE OF THE NEUTRON FLUX ON THE WATER CONTENT IN THE UPPER SURFACE LAYER OF MARS
For the physical interpretation of neutron measurements, numerical model calculations of the spectral neutron flux density at the Martian orbit are currently being performed for various soil water contents and various observing conditions.
To calculate the neutron flux at an altitude of 400 km above the Martian surface, we took the standard model of the Galactic cosmic ray flux used by Masaric and Reedy (1996) to calculate the neutron flux at the orbit of Mars and took into account all of the escape directions of secondary neutrons from the Martian surface. Figure 4 shows the calculated neutron spectra as a function of the soil water content. We performed our calculations by using the standard MCNPX software package to numerically simulate the neutron production in various environments (Waters, 1999). As a simple soil model, we took a homogeneous layer 500 g/cm2 in thickness with the elemental composition corresponding to the Viking-1 and -2 measurements (Dagge et al., 1991) with the addition of variable water content (in % by mass). These data are in good agreement with previous calculations (Drake et al., 1988). To estimate the effects of the atmospheric thickness between the surface and the point of observation at the orbit, we calculated the neutron fluxes for atmospheric column densities of 5, 15, and 25 g/cm2. The change in orbital neutron flux due to the change in atmospheric thickness proved to be much smaller than the observed variability (Fig. 4, the lower part). Therefore, below, we interpret the measured orbital neutron-flux variability as the result of neutron-flux variability on the Martian surface.
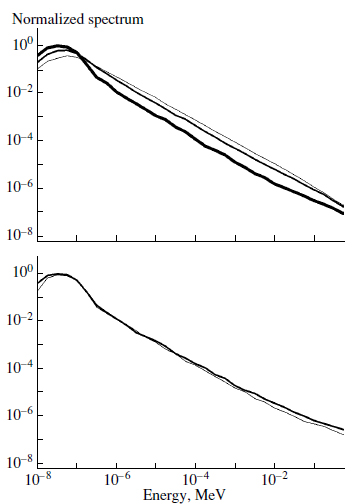
Fig. 4. The upper panel shows calculated spectra for the neutron flux from the Martian surface as a function of the water content (in % by mass). The thickest and mediumthickness lines correspond to 10% and 1% of water, respectively; the spectrum for absolutely dry soil is indicate by the thin line. The lower panel shows computed spectra of the neutron flux from the Martian surface as a function of the atmospheric thickness. The thick and thin lines correspond to an atmospheric thickness of 25 and 5 g/cm2, respectively.
We can estimate the thickness of the measured surface layer whose composition determines the flux and energy spectrum of the emergent neutrons. Clearly, the characteristic thickness of this layer depends on the neutron energy, the soil composition and homogeneity, the presence of layers or water ice in the soil, etc. For homogeneous soil, the thickness of the measured layer is 10–20 cm for neutrons with energies > 10 MeV and increases to 1–2 m as the neutron energy decreases to thermal values. The law of monotonic increase in the thickness of the measured layer with decreasing energy breaks down if the mass fraction of water in the layer becomes large enough, because in this case the lowenergy neutron mean free path significantly decreases due to the large cross section for the neutron capture by hydrogen nuclei. The thickness of the measured layer also significantly depends on how inhomogeneous the soil is. In general, the thickness of the measured layer should be considered separately.
To estimate the dependence of the HEND detector count rate on the soil water content, we convolved the calculated neutron spectra with the detector response functions, which are known from calibrations. The relative MD detector (epithermal neutrons) count rate is plotted against the soil water content in Fig. 1 from Litvak et al. (2003). To pass from absolute neutrons fluxes to concentrations of bound soil water by using this curve, we must compare the neutron flux and the water content at least within one geographic region. The most natural solution of this problem is the normalization of all measurements to the maximum flux, followed by a comparison of this quantity with the water concentration measured in the region where the maximum flux is recorded. In neutron spectroscopy, the highest flux of high-energy neutrons corresponds to the lowest soil water content; therefore, the chosen method actually implies the normalization to the driest areas on Mars. Prolonged observations of the Martian surface indicate that the maximum flux of both fast and epithermal neutrons is stably observed in southern equatorial Martian regions, near Solis Planum (see Fig. 5, see insertion). Unfortunately, we have no direct measurements of the concentration of bound water in these regions. However, we can estimate it indirectly by using the results of a spectrometric analysis of the soil samples taken by the Viking-1 and Mars Pathfinder landers in regions close to the equator. Although the accuracy of these measurements is low, we may say that the concentration of bound water in the uppermost layer of soil varies over the range 1–3% (Biemann, 1979; Wanke et al., 2001). Thus, we may conclude that the concentration of bound water in the driest Martian regions can reach 1.5%. This result is confirmed by the analysis of the seasonal neutron-flux variations caused by the annual circulation of atmospheric carbon dioxide. Thus, the model-dependent interpretation of the thermal and epithermal neutron measurements for various seasons shows that the water concentration in the driest Martian regions must be larger than 1.5% (Feldman et al., 2002). Comparison of the experimental neutron flux–CO2 thickness relation with the results of numerical simulations also indicates that the best agreement is achieved if the normalization to 1.5% in the driest Martian regions is used (Litvak et al., 2003).
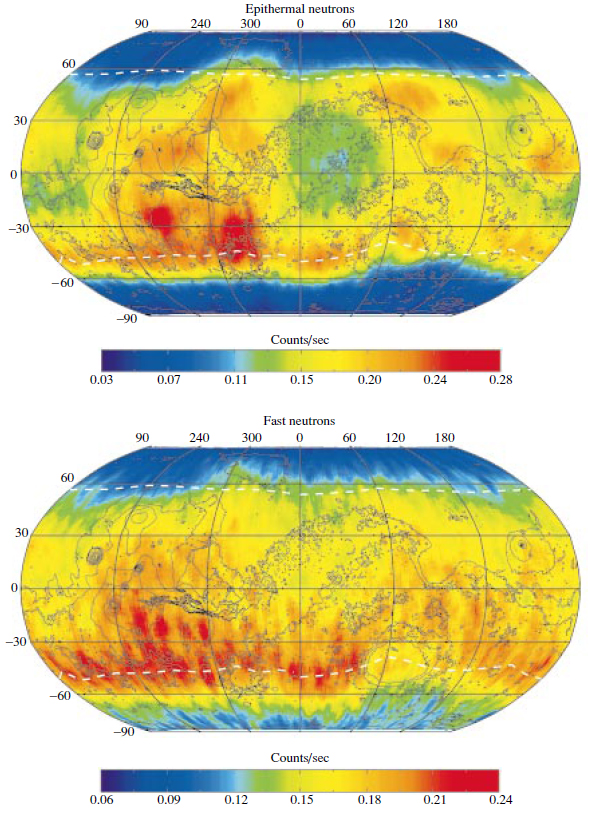
Fig. 5. The maps of orbital measurements of the high-energy neutron flux from Mars. The epithermal neutron map (upper panel) was constructed for episodes with Ls = 330°–360° (southern hemisphere) and Ls = 90°–135° (northern hemisphere). The map of fast neutrons with energies 0.85–2.2 MeV (lower panel) was also constructed for episodes with Ls = 330°–360° (southern hemisphere) and Ls = 90°–135° (northern hemisphere). The pixel size is 1°×1° for both maps. The linear smoothing in a 5°×5° window was used to construct the maps. The boundaries of the winter carbon dioxide deposits at the Martian poles are indicated by the white dotted line.
Comparative characteristics of probable regions with a high water content in Martian soil
| Region | Region coordinates | Estimates of soil water content (% by mass) for homogeneous-layer model |
| Northern permafrost region | Higher than 55° N | Latitude belt 55°–65°: from 4 to 29% Latitude belt 65°–75°: from 6 to 31% Latitude belt 75°–85°: from 15 to 41% |
| Southern permafrost region | Higher than 60° S | Latitude belt 55°–65°: from 3 to 32% Latitude belt 65°–75°: from 9 to 35% Latitude belt 75°–85°: from 24 to 44% |
| Arabia region | 10° S to 30° N 350° E to 50° E |
from 5 to 8% |
| Memnonia region | 30° S to 0° 180° E to 210° E |
from 4 to 7% |
THE MAPS OF ORBITAL MEASUREMENTS OF THE NEUTRON FLUX FROM THE EXPOSED (SUMMER) MARTIAN SURFACE
About a third of the Martian year passed over the ten months of orbital measurements from February through December 2002. The neutron flux from the surface significantly changes when the winter seasonal carbon dioxide cover accumulates on the surface. Therefore, observations of the neutron flux from Mars allow the following two problems associated with the properties of its surface to be solved.
(1) To measure the spatial neutron-flux variations on the exposed (summer) Martian surface free from the seasonal carbon dioxide cover. These data allow the water content to be estimated in various Martian regions. The first results of the solution of this problem are presented below.
(2) To measure the seasonal neutron-flux variations in the northern and southern hemispheres of Mars, which allows us to measure the condensation dynamics and estimate the thickness of the winter CO2 layer in various Martian regions. This issue is studied in the accompanying paper of this series (Litvak et al., 2003).
Only the data obtained during Martian summer should be used to study the soil composition. A map of the HEND orbital measurements of the epithermal neutron flux from the exposed (summer) Martian surface is shown in Fig. 5 (the upper part). The map is composed of two parts. The northern part was constructed from the measurements over the period from Ls = 90° to Ls = 135°, when the summer began in the northern hemisphere and the CO2 cover was absent at all northern latitudes. The southern part corresponds to the initial period of observations from Ls = 330° to Ls = 360°, when the Martian summer ended in the southern hemisphere and the deposition of winter seasonal CO2 cover on the soil surface has not yet begun. Thus, the map in Fig. 5 reflects the composition of the main soil and the content of its water or water ice.
Figure 5 (the lower part) also shows a similar map of fast neutrons in the energy range 0.85–2.2 MeV. It was also composed of the two maps for the northern and southern hemispheres of Mars for the exposed (summer) surface obtained over the periods from Ls = 90° to Ls = 135° and from Ls = 330° to Ls = 360°, respectively. Both maps (Fig. 5) show similar spatial variations of the fluxes of epithermal and fast neutrons on the Martian surface. These maps have an absolute maximum of the neutron flux in one region of Solis Planum with the center with coordinates of about 265° E and 25° S. The soil in this region probably has a minimum water content. A low neutron flux in high-latitude Martian regions in the north and the south is observed on both maps. The dynamic variability range corresponds to a factor of about 10 and about 3 for epithermal and fast neutrons, respectively.
The neutron map of Mars significantly differs from the neutron map of the Moon by the large amplitude of the spatial variations. The Lunar Prospector measurements revealed that the epithermal neutron flux from the lunar surface changes from point to point only by 15–20% (Feldman et al., 1998). The neutron radiation of the Moon, as well as Mars, is produced by cosmic rays. The lunar neutron variations are attributable to different compositions of the rock-forming elements of the soil in different regions. The Martian surface consists of similar elements but the much larger spatial variations of the neutron flux from different regions for this planet result from the presence of various amounts of water in the soil. Thus, in contrast to the Moon, Mars is a hydrologically active planet.
THE NORTHERN AND SOUTHERN PERMAFROST REGIONS
Evidence of Permafrost. To quantitatively interpret the neutron measurements, we use the relative spatial flux variations defined as the ratio of the count rate in a given pixel of the map to the maximum observed flux Fmax = 0.27±0.05 counts/s from the regions with coordinates 265° E and 25° S near Solis Planum. It follows from the neutron measurements of the free surface that there are vast regions of a neutron deficit in the north of Mars higher than 55° N and in the south of Mars higher than 60° S where the flux attenuation exceeds a factor of 3. The boundaries of these regions correspond to the transition from blue to green on the maps of epithermal neutrons in the north at latitudes 55°-60° N and in the south at latitudes 60°-65° S (see Fig. 5 and the table). The absolute minima of the epithermal neutron flux are observed in the north, Fmin(N)= 0.036±0.018 counts/s, in the region at 340° E, 86° N and in the south, Fmin(S)= 0.037±0.018 counts/s in the region at 313°E, 85° S (Fig. 5, the upper part).
The mean soil water content for the subpolar latitude belts of Mars can be estimated by numerically calculating the model of a homogeneous layer. It follows from these estimates that when the epithermal neutron flux decreases by a factor of 3 to 10, the water content in the soil surface layer of the subpolar regions must be 10–30% by mass. Since this value exceeds the possible content of bound water in the soil, water in the soil of the subpolar regions must be in the form of free water ice.
In general, the problem of the water ice distribution in the depth of the observed soil layer is an ill-defined problem, because the neutron flux depends on the composition of the material throughout the column (g/cm2) of the measured soil layer. However, this question can be significantly elucidated by simultaneously analyzing the decrease in the flux of neutrons with different energies and in the flux of nuclear radiation in the 2.2-MeV line. Since the flux of neutrons with different energies and the flux in the line of neutron capture by hydrogen originate from different depths, the layered soil composition must affect the ratio of these fluxes compared to a homogeneous layer.
Comparison of the observational data for neutrons with different energies and the 2.2-MeV flux indicates (Boynton et al., 2002; Mitrofanov et al., 2002; Feldman et al., 2002) that the two-layer permafrost soil model is in best agreement with the observations. A relatively dry near-surface layer with a column density of about 20–50 g/cm2 in which the water content does not exceed 3% by mass was shown to be at the top. This significantly contributes to the generation of the fast neutron flux from the Martian surface. A layer with a very high mass fraction of water ice (about 35–50%) underlies the dry near-surface layer. The fluxes of thermal and epithermal neutrons are generated in this layer. The deuterium 2.2-MeV nuclear line, which emerges when a nucleus of hydrogen H captures a neutron to form deuterium D, is also generated in this layer. Based on the seasonal neutron-flux measurements, Litvak et al. (2003) also managed to independently test the conclusion about the layered permafrost structure by taking into account the fact that the variable thickness of the seasonal CO2 layer was independently determined from MOLA data (Smith et al., 2001). The possibility that water ice is permanently present in the near-surface soil is determined by the thermal inertia of the soil and by the daily and seasonal temperature variations. The calculated boundary of the permanent water ice in the south of Mars is in excellent agreement with the permafrost boundary determined from neutron measurements (Boynton et al., 2002).
Thus, based on the HEND neutron measurements (Fig. 5) as well as on the measurements with the neutron spectrometer (Feldman et al., 2002) and the germanium gamma-ray spectrometer (Boynton et al., 2002), we can argue that there are extended permafrost regions with a water mass fraction of more than 35% in the north higher than 55° N and in the south higher than 60° S. These regions together occupy up to 15% of the Martian surface.
Comparison of the boundaries of the Permafrost Regions with the Boundary of the Seasonal Carbon Dioxide Cover. The permafrost boundaries in the north and the south do not coincide with the boundaries of the winter CO2 deposits on the Martian surface (see Fig. 5). This implies that the seasonal condensation of CO2 snow with a low H2O content on the soil surface cannot be responsible for the penetration and accumulation of water in the Martian soil.
Whereas areas where the boundary of the northern permafrost region coincides with the boundary of the seasonal carbon dioxide cover can still be found in the north, the permafrost boundary in the south everywhere runs about 10° closer to the south pole than the latitudinal boundary of the seasonal CO2 cover. The permafrost boundary runs along the southern boundary of the Hellas region but does not go to this lowland, although seasonal CO2 deposits and observed here and the elevation is much lower than the dichotomy level.
The Dependence of Permafrost on Elevation. The entire northern permafrost region has negative elevations relative to the dichotomy level. Its elevation changes by several kilometers from the lowest point with an elevation of -6.6 km to the highest point with an elevation of -1.9 km relative to the dichotomy level. In contrast, the entire southern permafrost region has elevations from -1.3 to 4.8 km relative to the dichotomy level. Therefore, the presence of permafrost on Mars cannot be attributed to the very low elevation of the subpolar region, as is the case in the north, or to the high elevation, as is the case in the south.
The upper panel in Fig. 6 shows plots of the epithermal neutron flux against longitude at 5° steps along the boundary latitude belt 55°-65° N of the northern permafrost region. The lower panel in Fig. 6 shows a plot of the mean surface elevation as measured by MOLA against longitude within this latitude belt.
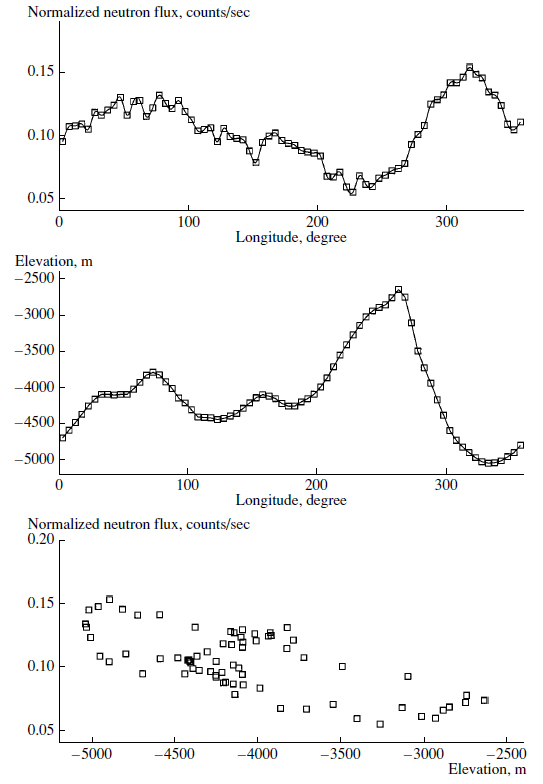
Fig. 6. Correlation between the Martian surface elevation and the epithermal neutron flux in the latitude belt 55°–65° N (lower panel). The upper panel shows a plot of the epithermal neutron flux versus longitude in the latitude belt 55°–65° N. The middle panel shows a plot of the surface elevation as measured by the MOLA onboard Mars Global Surveyor versus longitude in the latitude belt 55°–65° N.
For the latitude belt 55°-65° N of the northern permafrost region, the minimum and maximum epithermal neutron fluxes, Fmin = 0.055 counts/s and Fmax = 0.155 counts/s, are observed at 230° E and 330° E, respectively. According to the MOLA measurements, the region with longitude 230° E has a relative elevation maximum of about –2500 m relative to the dichotomy level. As one displaces along the latitude belt 55°-65° N into the region at 330° E, the elevation decreases to a minimum value of –5100 m for this belt. The increase in neutron flux by a factor of 3 from Fmin = 0.055 counts/s to Fmax = 0.155 counts/s may be assumed to result from the decrease in elevation from a local maximum of -2500 m to a local inimum of -5100 m.
If this change in neutron flux is described in terms of the model of a homogeneous layer, then the soil water content when passing from the maximum to the minimum elevation must decrease by a factor of about 5, from 25% to 5% by mass. If we use the two-layer model of permafrost soil with a fixed water content of 3% and 35% by mass in the soil of the upper and lower layers, respectively (see, e.g., Boynton et al., 2002), then this change in neutron flux when passing from the high region near 230° E to the low region near 330° E can be attributed to the increase in the thickness of the upper (relatively dry) layer from 30 to 70 g/cm2.
Although there is a clear negative correlation between the neutron flux and the local elevation for the longitude range from 230° E to 330° E along the latitude belt 55°-65° N, no such correlation is observed in the remaining longitude ranges. The same can also be said about the southern permafrost region. Thus, for example, the boundary of the southern permafrost region near longitudes 50°-100° passes through the southern neighborhood of the Hellas Basin, where the elevation decreases to –8180 m. In this case, no appreciable epithermal neutron flux variations are observed (see Fig. 5).
Thus, our comparison of the northern and southern permafrost regions suggests that the different geologic nature of the surface has virtually no effect on the characteristic content of water ice in the soil. However, we may assume that the elevation can affect the permafrost structure for the geophysical conditions in the north of Mars.
THE MOIST EQUATORIAL ARABIA AND MEMNONIA REGIONS
Apart from the northern and southern permafrost regions, two vast regions near the equator with low neutron fluxes (see the table) are clearly seen on the epithermal neutron map (Fig. 5). The first region is located in the Arabia province and its longitude ranges from 350° E to 50° E. The second region is diametrically opposite to the first region in the Memnonia province and its longitude ranges from 180° E to 210° E.
The neutron flux in the Arabia and Memnonia depression regions decreases by up to a factor of 3, which corresponds to a water mass fraction of 3–10% for homogeneous soil. This value is close to the maximum allowable content of chemically bound water in Martian soil (Basilevsky et al., 2003). On Earth, a high concentration of chemically bound water is known to be observed, for example, in clay rocks. Therefore, the assumption about a high content of chemically bound water in the Arabia and Memnonia regions must lead us to conclude that the soil of these regions was in direct contact with water during a long geologic time.
The orbital observations correspond to averaging over regions with a size of about 60 km. Therefore, the estimated water content is an average value, implying that the soil water content in some areas of the Arabia terrain and Memnonia must be higher than the maximum allowable value for chemically bound water. However, the alternative assumption about the presence of free water ice in the soil near the equator is also difficult to explain.
The point is that water ice in the observed soil layer must sublimate under equatorial conditions. The only possibility to preserve ice in the equatorial soil is to assume that its thermal conductivity is very low; as a result, daily heating reaches quite a small depth. The thermal inertia map for Mars has vast regions with a low thermal inertia of the soil (Jakosky et al., 2001). Clay sedimentary rocks usually have such a thermal inertia. The regions with a low thermal inertia intersect with the moist Arabia and Memnonia regions, but their boundaries do not closely coincide. First, the regions with a low thermal inertia are much larger than the moist regions, suggesting that a low thermal inertia may be a necessary but not sufficient condition for the existence of a moist region near the equator. Second, in some areas, moist regions lie outside the region with a low thermal inertia. This may imply that regions with a high moisture have an inhomogeneous composition; in some areas, a high moisture may be related to a very high content of chemically bound water, while in other areas, where the thermal conductivity is low, free water ice can be added to soil with a high content of chemically bound water.
The assumption that water ice can stably exist on the equator in near-surface soil with a low thermal inertia (Paige, 1992) can now be experimentally tested by using neutron measurements. It should also be noted that Sinus Meridianii, in which hematite deposits were found (Christensen et al., 2000; Christensen et al., 2001b), is located at the western boundary of the moist Arabia region. This mineral is formed from iron-rich water solutions in sedimentary or hydrothermal processes. Under terrestrial conditions, these processes give rise to minerals with a high content of chemically bound water (Basilevsky et al., 2003). Therefore, for the Arabia region, we may argue that the low thermal inertia of the soil and the presence of hematite deposits in the region indirectly confirm the conclusion drawn from neutron measurements: the mass fraction of water in the soil of this equatorial region can reach 10%. This water is probably present in the soil in the form of chemically bound water or even free water ice.
The main results of the first year of our measurements of the neutron flux from the Martian surface can be summarized as follows:
(1) There are permafrost regions in the north and the south of Mars in which a layer of soil with water ice whose mass fraction is 35–50% underlies a layer of relatively dry soil 20–50 g/cm2 in thickness. The total area of the northern and southern permafrost regions on Mars reaches 15%.
(2) Two regions with a high soil water content were detected on the Martian equator: the moist Arabia region and the moist Memnonia region (see the table). The water content in these regions reaches 10% by mass, which is close to the limiting concentration of chemically bound water in the soil. The low thermal inertia of the soil in Arabia also suggests that the high water content can be associated with the presence of water ice.
The HEND neutron maps closely match the maps independently obtained from the neutron spectrometer, which is the second instrument for neutron measurements in the GRS instrumentation (Feldman et al., 2002). Our estimates of the water content are also confirmed by the deuterium 2.2-MeV nuclear line measurements (Boynton et al., 2002). The close agreement between the observational data obtained by three different instruments based on different methods of recording the neutron radiation suggests that our results are highly reliable.
Our results raise the following questions for the subsequent studies of Mars:
(1) How were the northern and southern permafrost regions in which a layer of water ice filling more than 50–70% of the volume underlies a thin and relatively dry layer of soil formed? When the soil interacts with the atmosphere, the volume of the pores can, in principle, be completely filled with water ice. However, to explain the formation of a soil layer with an ice volume of more than 50% requires suggesting the simultaneous formation of soil and ice water. We may assume that the ice-rich near-surface layer could be formed through the prolonged accumulation of layered seasonal water ice and dust deposits, but this process should be analyzed quantitatively.
(2) The permafrost of the northern and southern Martian regions has a layered structure and similar mass fractions of water ice, although the geologic properties of these regions significantly differ. These regions have different geologic ages, different geologic histories, and different reliefs. The northern region is lower than the dichotomy level by 2500–5000 m, while the southern region is higher than this level by 1000–2000 m. Why was permafrost with the same structure formed under different geologic conditions of the north and the south? The possible answer is that this permafrost structure is not related to the properties of the basement rocks but was formed by the layered deposits of dust and water ice. In the south, no evidence of permafrost is seen in the southern part of the Hellas Basin, although the elevation and climatic conditions in it are similar to those in the regions of the northern subpolar lowland containing permafrost. This lowland is covered by seasonal carbon dioxide, and it is the lowest area on Mars.
(3) The boundary of the observed permafrost regions agrees with the model boundary of soil ice based on thermophysical estimates and the seasonal temperature profile. However, the thermophysical conditions in the latitude belts of Mars significantly depend on the inclination of its rotation axis. It thus follows that the formation time of the permafrost regions on Mars cannot exceed the lifetime of the current inclination of the Martian rotation axis.
(4) What is the possible cause of the high water content in the two symmetric equatorial Arabia and Memnonia regions? Both chemically bound water and water in the form of free ice, probably, could not enter the soil of these regions and be preserved there in such amounts under the current climatic conditions. We may assume that the Martian poles were at these locations at a distant geologic epoch (Schultz and Lutz, 1988; for more detail, see Basilevsky et al., 2003) and that the waterrich soil was formed under the polar caps of this epoch. Once the positions of the poles changed, the thermal conditions also changed, but a high water content was preserved in the soil. It is important to find out whether free ice is present in the soil of the equatorial Arabia and Memnonia regions. If areas with near-surface ice will be reliably detected, then they will be of great interest both in studying the composition of this ice and in selecting its samples to be returned to Earth for analysis in terrestrial laboratories.
(5) The nuclear-physical methods allow the water content in a thin near-surface layer 1 to 2 m in thickness to be studied. These methods should be supplemented with Martian surface radar, which allows water to be searched for at depths of several tens and hundreds of meters. A simultaneous analysis of the nuclear-physical and radiometric measurements makes it possible to construct a three-dimensional model of the Martian surface composition.
(6) Based on our measurements, we can construct an engineering model for the radiation environment on the Martian surface. The neutron flux and energy distribution were found to significantly change in different surface areas, implying that the proper choice of a landing site on Mars for humans can significantly reduce the risk of radiation damage.
We thank all of those who designed and produced the HEND and the 2001 Mars Odyssey space mission for the successful preparation of this space experiment.
1. Basilevsky, A.T., Litvak, M.L., Mitrofanov, I.G., et al., Search for Traces of Chemically Bound Water in the Martian Surface Layer Based on HEND Measurements onboard 2001 Mars Odyssey, Astron. Vestn., 2003, vol. 37, no. 5, pp. 387–396.
2. Biemann, K., The Implications and Limitations of the Findings of the Viking Organic Analysis Experiment, J. Mol. Evol., 1979, vol. 14, pp. 65–70.
3. Boynton, W.V., Feldman, W.C., Squyres, S.W., et al., Distribution of Hydrogen in the Near Surface of Mars: Evidence for Subsurface Ice Deposits, Science, 2003, vol. 297, pp. 81–85.
4. Boynton, W.V., The Mars Odyssey Gamma-Ray Spectrometer Instrument Suite, Space Sci. Rev., 2003.
5. Christensen, P.R., Bandfield, J.L., Clark, R.N., et al., Detection of Crystalline Hematite Mineralization on Mars by the Thermal Emission Spectrometer: Evidence for Near Surface Water, J. Geophys. Res., 2000, vol. 105, pp. 9623–9642.
6. Christensen, P.R., Bandfield, J.L., Hamilton, V.C., et al., Mars-Global-Surveyor Thermal Emission Spectrometer Experiment: Investigation Description and Surface Science Results, J. Geophys. Res., 2001, vol. 106, pp. 23823–23872.
7. Christensen, P.R., Morris, R.V., Lane, M.D., et al., Global Mapping of Martian Hematite Mineral Deposits: Remnants of Water Driven Processes on Early Mars, J. Geophys. Res., 2001, vol. 106, pp. 23873–23885.
8. Dagge, G., Dragovitsch, P., Filges, D., and Bruchner, J., Monte Carlo Simulation of Martian Gamma-Ray Spectra Induced by Galactic Cosmic-Rays, Proc. Lunar Planet. Sci. Conf. XXI, 1991, pp. 425–435.
9. Drake, D.M., Feldman, W.C., and Jakosky, B.M., Martian Neutron Leakage Spectra, J. Geophys. Res., 1988, vol. 93, pp. 6353–6368.
10. Feldman, W.C., Boynton, W.V., Jakosky, B.M., Mellon, M.T., et al., Redistribution of Subsurface Neutrons Caused by Ground Ice on Mars, J. Geophys. Res., 1993, vol. 98, pp. 20855–20870.
11. Feldman, W.C., Boynton, W.V., Tokar, R.L., et al., Global Distribution of Neutrons From Mars: Results From Mars Odyssey, Science, 2002, vol. 297, pp. 75–78.
12. Feldman, W.C., Maurice, C., Binder, A.B., et al., Fluxes of Fast and Epithermal Neutrons From Lunar Prospector: Evidence for Water Ice at the Lunar Poles, Science, 1998, vol. 281, pp. 1496–1500.
13. Feldman, W.C., Normalization of H data, presented on 2001 Mars Odyssey GRS Meeting, 2002; http://grs.lpl.arizona. edu/.
14. Jakosky, B.M. and Mellon, M.T., High-Resolution Thermal Inertia Mapping of Mars: Sites of Exobiological Interest, J. Geophys. Res., 2001, vol. 106, pp. 23887–23908.
15. Litvak, M.L., Mitrofanov, I.G., Kozyrev, A.S., et al., Seasonal Neutron-Flux Variations in the Polar Caps of Mars as Revealed by the Russian HEND Instrument Onboard the NASA 2001 Mars Odyssey Spacecraft, Astron. Vestn., 2003, vol. 37, no. 5, pp. 378–386.
16. Malin, M.C. and Edgett, K.S., Evidence for Recent Groundwater Seepage and Surface Runoff on Mars, Science, 2000, vol. 288, p. 2330.
17. Masarik, J. and Reedy, R.C., Gamma Ray Production and Transport in Mars, J. Geophys. Res., 1996, vol. 101, pp. 18891–18912.
18. Mellon, M.T. and Phillips, R.J., Recent Gullies on Mars and the Source of Liquid Water, J. Geophys. Res., 2001, vol. 106, pp. 23165–23180.
19. Mitrofanov, I.G., Anfimov, D.S., Kozyrev, A.S., et al., Maps of Subsurface Hydrogen From High Energy Neutron Detector, Science, 2002, vol. 297, pp. 78–81.
20. Mohlmann, D., Adsorption water in mid and low latitude martian soil, Proc. Second European Workshop on Exo-Astrobiology, 2002, SP-518, pp. 169–172.
21. Paige, D.A., The Thermal Stability of Near Surface Ground Ice on Mars, Nature (London), 1992, vol. 356, pp. 43–45.
22. Prettyman, T.N., Feldman, W.C., Boynton, W.V., et al., Atmospheric Corrections for Neutrons Reveal Variations in Surface Composition in the Tharsis Region, LPSC XXXIV, 2003, abstract no. 1950.
23. Schultz, P.H. and Lutz, A.B., Polar Wandering on Mars, Icarus, 1988, vol. 73, pp. 91–141.
24. Smith, D.E., Zuber, M.T., Neumann, G.A., et al., Seasonal Variations of Snow Depth on Mars, Science, 2001, vol. 294, pp. 2141–2146.
25. Wanke, H., Bruckner, J., Dreibus, G., et al., Chemical Composition of Rocks and Soils at the Pathfinder Site, Space Sci. Rev., 2001, vol. 96, pp. 317–330.
26. Waters, L.S., Ed., MCNPX User's Guide, Document LA-UR-99-6058, Los Alamos: Natl. Lab., 1999.
