")
")
The Mercury Gamma and Neutron Spectrometer (MGNS) on board the Planetary Orbiter of the BepiColombo mission
I.G. Mitrofanova, A.S.Kozyrev a, A.Konovalova, M.L.Litvaka, A.A.Malakhova, M.I.Mokrousova, A.B.Sanina, V.I.Tret'ykova, A.V.Vostrukhina, Yu.I.Bobrovnitskijb, T.M.Tomilinab, L. Gurvitsc, A.Owensd
aInstitute for Space Research, Profsojuznaja 84/32, 117997 Moscow ,Russian Federation
bA.A.Blagonravov Institute of Mechanical Engineering Research, M.Khariton'evskij, 4, 101990 Moscow, Russian Federation
cJoint Institute for VLBI in Europe, PO Box 2, 7990 AA Dwingeloo, The Netherlands
dEuropean Space Agency, ESTEC, Keplerlaan 1, 2201 AZ Noordwijk, The Netherlands
Abstract - The main goals and objectives are presented for the Mercury Gamma and Neutron Spectrometer (MGNS) to be flown on board the Mercury Planetary Orbiter of ESAs BepiColombo mission. The instrument design is discussed and from an analysis of its properties, it is shown that the MGNS is capable of measuring the elemental composition of the shallow subsurface, providing a sensitive tool to discriminate between a number of proposed models for Mercury's origin. The instrument will also test for the presence of water ice deposits on the permanently shadowed polar craters of the planet.
DOI: 10.1016/j.pss.2009.01.005 - http://www.sciencedirect.com/science/article/pii/S003206330900021X
-------------------------------------------------------------------------------------------------------------------------------------------------
2. Scientific goals of MGNS investigations
3. Objectives for the MGNS investigations
4. Physical implementation of the MGNS instrument
5. Design of the MGNS instrument
-------------------------------------------------------------------------------------------------------------------------------------------------Mercury is the third body of the solar system together with Moon and Mars, whose elementary composition might be studied by orbital observations of induced planetary gamma ray and neutron emission. The nuclear emission is produced by the bombardment of energetic cosmic rays, which freely propagate from interstellar space to the inner volume of the solar system. Particles collide with soil nuclei up to depths of 1–2 m of the subsurface and produce new nuclei and secondary high-energy neutrons in the 1–20 MeV energy range. In the leakage process, these secondary neutrons induce secondary gamma rays due to in-elastic scattering and capture reactions on soil nuclei. Natural radioactive isotopes of K, Th and U in the regolith, also produce gamma-ray lines by spontaneous radioactive decay. Therefore, nearby spacecraft may expect to detect these nuclear gamma-ray lines and from their relative strengths and energies determine elemental abundances and soil composition. One may also measure the energy spectrum of secondary neutrons from the surface to determine the hydrogen content of the subsurface, since hydrogenous material is extremely effective in moderating neutrons.
Measurements of nuclear emission from the Moon were pioneered by Vinogradov and Surkov from Luna-10 and 12 in 1966 (Vinogradov et al., 1966), and by Adler and colleagues from Apollo 15 and 16 in 1972 (Adler et al., 1969).
Much later the global mapping of lunar gamma rays and neutrons was performed by the instruments on the Lunar Prospector Orbiter (Lawrence et al., 1998; [Feldman et al., 1998a] and [Feldman et al., 1998b] ). Maps of the nuclear lines of potassium, thorium, iron and other soil-composing elements were measured using a BGO scintillation detector which formed the central detection element of the gamma-ray spectrometer. The most intriguing result of the neutron measurements from the Moon was the detection of possible water ice in the bottom of permanently shadowed craters—both at the north and south poles. The possibility of water ice on the Moon was originally inferred from the analysis of radio data from Clementine (Nozette et al., 1996).
In 2002 NASA's Mars Odyssey started the global mapping of Martian gamma rays and neutrons. For the first time, a high-purity Ge detector was used as a remote-sensing gamma-ray spectrometer (the GRS) (Boynton et al., 2004). Maps of the regional variations of H, Si, Cl, Fe, etc. were produced, based on their nuclear line emission (Boynton et al., 2007). Gamma-ray data from the GRS also provided maps of the radioactive isotopes K and Th in the martian surface (Tailor et al., 2006a, b; Boynton et al., 2007). Neutron data from Mars Odyssey have also delivered surprising results, namely, two strong depressions in the detected flux of epithermal neutrons from large areas of Mars: northward and southward from 60° of latitude, and also in two equatorial regions of Arabia and Memnonia (Boynton et al., 2002; Feldman et al., 2002; [Mitrofanov et al., 2002] , [Mitrofanov et al., 2003a] and [Mitrofanov et al., 2003b] ). The "dips" are interpreted as the signatures of subsurface water. Neutron data deconvolution ( [Mitrofanov et al., 2003b] and [19] ) indicated that both provinces above 60° are rich with water ice, whose content could be as high as 40–50 wt%. Thus water ice could be the major component of the soil in these regions. The creation of these regions in the past, and their influence on the present Martian climate are still the open questions requiring further studies of the planet.
This paper presents the concept and operation of the Mercury Gamma and Neutron Spectrometer (MGNS), which will carry out similar studies of gamma-ray and neutron emission from the planet Mercury. The experiment will be performed on board of the Mercury Planetary Orbiter (MPO), which is one of two spacecraft forming ESAs "BepiColoimbo" mission. The mission is scheduled for launch in 2014 (for further details see Benkhoff, 2009). The MGNS instrument is a contribution of the Federal Space Agency of Russia to this mission and its implementation is based on International agreement between the FSA and ESA.
2. Scientific goals of MGNS investigations
Because Mercury lacks a thick atmosphere, its natural nuclear emissions could be detected from orbit, i.e., gamma rays arising from cosmic-ray interactions and those arising form the natural radioactive decay of K, Th and U. Mercury has a very weak magnetic field with cut-off rigidity near the equator of ∼1 MeV. Therefore, the galactic cosmic rays are essentially unimpeded and interact directly with the shallow subsurface producing copious secondary neutrons within the first 1–2 m of the surface (Fig. 1). These neutrons interact with the soil nuclei either by in-elastic scattering or capture reactions, producing secondary nuclear gamma rays. Each chemical element has a unique set of nuclear lines, so the data from a gamma-ray spectrometer in near-orbit can, in principle, uniquely identify the elemental composition of the Mercury shallow subsurface.
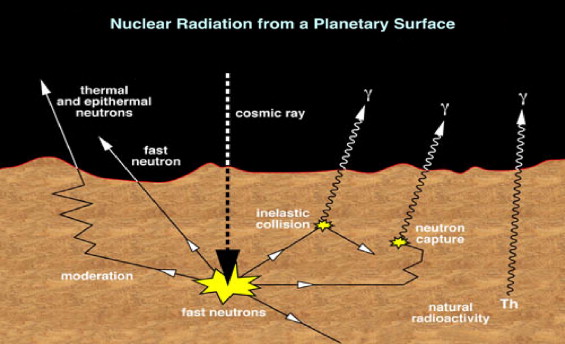
Fig. 1. Galactic cosmic rays produce secondary neutrons which induce gamma-ray line emission from the surface of Mercury. Line emission also results from natural radioactive isotopes in the surface regolith.
The intensity of a gamma-ray line of a particular element depends on the spectrum and flux of secondary neutrons and so knowledge of the spectral density of neutrons is also a necessary prerequisite for the determination of the elemental abundance. The energy spectrum of leakage neutrons, in turn, depends on the elemental composition of the soil. A neutron with a mass m, loses a small fraction of energy -m/(M+m) in a collision with heavy nucleus of mass M. However, when m=M, the incident particle will lose half its energy, as is the case when a neutron collides with a hydrogen nucleus. Thus, it can be seen that the addition of even a little hydrogen into a soil will decrease the leakage flux of epithermal and high-energy neutrons while simultaneously increasing the flux of thermal neutrons.
That is why instrumentation for nuclear remote sensing should include both a gamma-ray spectrometer for measuring gamma-ray lines and a neutron spectrometer for measuring the flux of leakage neutrons. One has to perform a joint data deconvolution for both gamma rays and neutrons in order to evaluate the abundance of all major soil-composing elements, including hydrogen.
Mercury is arguably the most extraordinary planet in the Solar system. One reason behind some of its exceptional properties is its proximity to the Sun. It explains the largest range of surface temperatures from -725 K at mid-day down to -90 K at midnight, and its spin–orbit resonance with the ratio of 2/3 between a day and a year. However, there are also some other mysterious features of Mercury, which do not result from its close proximity to the Sun. For example, Mercury has the largest uncompressed density among the planets of the solar system. It also has an anomalously high metal to silicate ratio, which may reveal the details of accretion of the early proto-planetary cloud into the planets (Siegfried and Solomon, 1974). Measurements of the elementary composition of the shallow subsurface in different regions over the planets surface may be the most important data to explain its anomalous composition. Data from the bottoms of impact craters and from the highlands may allow us to create a depth-dependent model of elemental abundances for the planet.
The second mystery of Mercury is the existence of a global magnetic field. The planet has a very slow rotation for the efficient generation of such a field. Mars with a much faster rotation has lost its field a long time ago. One may suspect that the dynamo has resulted from a high-eccentricity orbit and/or from a possible composition anomaly at the so-called "hot meridians" of the planet (e.g. see Dolginov, 1988). The two opposite hot meridians of Mercury are known to be related to the spin–orbital resonance: at the point of orbital perihelion one hot meridian obtains the largest heating power from the Sun, and after 1 year the opposite meridian gets the same heating energy at the next perihelion passage.
Therefore, the first Goal I of the MGNS onboard the Mercury Planetary Orbiter is the following: to determine the subsurface composition model(s) with a surface resolution of 400 km comparable with the relief features on Mercury and sufficient for testing composition anomalies at large impact basins and at the hot meridians on the planet.
The radio data from the Goldstone/VLA radar (Morgan and Anders, 1980) have provided a possible signature of the third mystery of Mercury. The radiolocation experiment has pointed to polar deposits on Mercury, which may possibly consist of water ice. This signature of water on the Mercury poles is quite similar to that found by the Clementine radar on the poles of the Moon (Nozette et al., 1996). Deposits of water ice may have accumulated on the bottoms of shadowed craters which are never sunlit. According to popular hypothesis, the sources of water are comet impacts with Mercury, when a temporal cloud of water vapor covers the planet for a short time. A fraction of vapor is trapped in the cold crater bottoms, which accumulate a layer of water ice from each encounter with a comet. This process could be very much similar to the accumulation of water ice deposits on the Moon and the difference between the water deposition reservoirs on Mercury and on the Moon may tell us a lot about the history of comet bombardment in the solar system. Another source of hydrogen on the Mercury surface is the solar wind. Implanted hydrogen is continuously accumulating in the subsurface soil, and regolith. However, reflection anomalies in the radio data from the Mercury poles may also be also identified with sulfur deposits on the surface (Sprague et al., 1995). Therefore, the mapping of H abundance over the entire planet allows us to study the global evolution of the Mercury surface. Thus, Goal II of the MGNS is the following: to determine of regional distribution of volatile depositions on the polar areas of Mercury, which are permanently shadowed from the Sun, and to provide a global map of hydrogen abundance.
Therefore, the study of the elementary composition of the Mercury surface and tests of polar ice deposits are the two main Goals of the MGNS investigation. Below the two prime scientific objectives for the MGNS investigations are determined in accordance with these two Goals (Section 3). One has to be sure, that the design of the instrument and its performance is appropriate to accomplishment these Goals (see Section 6).
3. Objectives for the MGNS investigations
Nine "standard" models have been proposed to predict the elementary composition of Mercury (see Table 1). To test these models for particular geomorphological regions of Mercury, the MGNS should provide statistically significant data for a set of reference nuclear lines, which are the most distinct for these models. One should consider only four reference spectra of gamma-ray lines for comparison of these nine models: the energy spectra for models #3, #6 and #8 can be interpolated from 4 basic models #1 (Chondrite Model, ChM), #2 (Equilibrium Condensation Model, ECM), #7 (Refractory-Rich Model, RRM) and #9 (Volatile-Rich Model, VRM). Predictable elementary compositions for the 4 basic models are presented in Table 2.
Table 1. Known models of the Mercury composition.
| Number | Model Type | Comment |
| # 1 | Chondrite Model (see Harmon, 1997) | Basic model ChM |
| # 2 | Equilibrium Condensation Model (see Basaltic Volcanism Study Project, 1981) | Basic model ECM |
| # 3 | Equilibrium Condensation Model with feeding zones (see Basaltic Volcanism Study Project, 1981) | Similar to ECM, may be interpolated from ECM |
| # 4 | Dynamically Mixed Model (see Basaltic Volcanism Study Project, 1981) | It differs from other models mainly by the absence of Fe and Ti |
| # 5 | Collisionally Differentiated Model (see Basaltic Volcanism Study Project, 1981) | It differs from other models mainly by the absence of Al, Fe, Ti, Th and U |
| # 6 | Vaporization Model (see Fegley and Cameron, 1987) | It is similar to the model #7 RRM |
| # 7 | Refractory-rich Model (see Goettel, 1988) | Basic model RRM |
| # 8 | Intermediate Model (see Goettel, 1988) | May be interpolated between RRM and VRM |
| # 9 | Volatile-rich Model (see Goettel, 1988) | Basic model VRM |
Table 2. Testing elementary composition for different models of surface composition.
| Model | Na | Mg | Al | Si | O | Ca | Ti | Cr | Mn | Fe | K | Th | U |
| (%) | (%) | (%) | (%) | (%) | (%) | (%) | (%) | (%) | (%) | (ppm) | (ppm) | (ppm) | |
| ChM | 0.06 | 20.3 | 3.4 | 22.1 | 45.1 | 3.7 | 0.20 | 2.3 | 0.05 | 2.9 | 6900 | 3.4 | 12 |
| ECM | - | 24.2 | 5.1 | 19.1 | 45 | 6.2 | 0.29 | 0.0 | 0.0 | 0.04 | - | 5.3 | 19 |
| RRM | - | 20.9 | 8.8 | 15.2 | 43.8 | 10.9 | 0.43 | - | - | - | - | - | |
| VRM | 1.0 | 19.2 | 1.7 | 21.1 | 43.0 | 2.2 | 0.08 | - | - | 11.4 | - | - | - |
| Moon | 0.4 | 5.9 | 7.1 | 21.6 | 43.0 | 7.5 | 1.59 | 0.27 | 0.16 | 12.0 | 2700 | - | - |
| Mars | 2.4 | 4.1 | 5.5 | 21.2 | 42.0 | 4.7 | 0.54 | 0.14 | 0.03 | 15.2 | 6100 | - | - |
| DR | ~40 | ~6 | ~5 | ~1.5 | ~1.1 | ~5 | ~7 | >2 | >5 | ~40 | ~2.6 | - | - |
One can also make use of, the known compositional data for Mars and the Moon to test between models. Indeed, Mercury is a planet of the terrestrial type and the difference of its regional compositions could be the same as the difference of individual planets. Therefore, there are another 2 testable models, the Moon (see Prettyman et al., 2006) and Mars (see Wänke et al., 2001). These models are also included in Table 2.
The accuracy of a comparison between particular composition models depends on the dynamic range of the variation in major elements (see estimated dynamic range (DR) in the last line of Table 2). It is clear that the larger the dynamic scale of elemental composition allows better discrimination between models. The most abundant elements Si and O have the smallest DR. However, the data for these elements is quite useful because they provide normalization values for other lines. There are three natural radioactive isotopes 40K, 232Th and 238U, whose abundances may characterize the conditions at the planets creation and also allow us to select the best scenario of Mercury surface formation. Finally, we have to study the content of hydrogen on the surface of Mercury, which was either due to a billion years of solar wind and cosmic ray bombardment, or water ice deposition at the poles. Therefore, according to Goal I, the MGNS instrument has to satisfy the following Objective I: to measure the nuclear lines of major soil-composing elements and natural radioactive isotopes with sufficient accuracy to test the basic composition models for distinctive geological regions over the entire surface of Mercury with a surface resolution of about 400 km.
All hydrogen-containing deposits change the leakage flux of neutrons because of the efficient moderation of neutrons by hydrogen. According to numerical calculations (see Section 6), the flux of epithermal neutrons from the planet subsurface strongly depends on the content of water. It is shown that the addition of 0.1 wt% of water into the dry regolith leads to a 5% decrease in the flux of epithermal neutrons. The presence of water ice deposits over the dry soil also results in a similar decrease of the leakage flux of epithermal neutrons. Thus, to accomplish the goal II, the MGNS has to address the following Objective II: to measure the spectral density of the neutrons leakage flux from thermal up to MeV energies to map the content of hydrogen over the entire planets surface with a resolution of 400 km and to test for the presence of spatially discrete water ice deposits at both poles.
4. Physical implementation of the MGNS instrument
The instrument has been designed specifically to address objectives (I) and (II) based on the measurements and required precision outlined above. These, in turn, determine the set of detectors and initial data products of the MGNS instrument (see Table 3).
Table 3. Measurements, detectors and initial data products of MGNS.
| Physical characteristics of Mercury nuclear emission | Requirements for MGNS measurements | Detectors and initial data products of MGNS instrument |
| Flux of gamma-ray lines from the Mercury subsurface | To measure the set of the most intense gamma-ray lines, which characterize the content of soil-composing elements and natural radio-isotopes | Scintillation detector of gamma-rays SCD/G with the high spectral resolution and high efficiency for gamma-rays Data product is energy spectrum of counts for gamma-rays with 4096 linear channels at the energy range 0.3–10.0 MeV |
| Flux of thermal neutrons from the Mercury surface | To measure the flux of thermal neutrons below the threshold of 0.4 eV | Detectors SD1 and SD2 with 3He proportional counters, with and without Cd shielding, respectively Data product is the time profile of counts for thermal neutrons, which is determined, as difference of counts from SD2 and SD1 |
| Flux of epithermal neutrons from the Mercury surface | To measure the flux of epithermal neutrons in two energy ranges 0.4 eV–1 keV and 0.4 eV–500 keV | Detector SD2 with 3He proportional counter and with Cd shielding for energy range 0.4 eV–1 keV Detector MD with 3He counter and polyethylene moderator inside Cd shield for energy range 0.4 eV–500 keV Data products are two time profiles of counts for epithermal neutrons from SD2 and MD |
| Flux of high-energy neutrons from the Mercury surface | To measure the flux of high-energy neutrons in the energy range 0.3–10.0 MeV | Sthylbene scintillator SCD/N within a anticoincidence plastic scintillator APC Data product is the energy spectrum of counts for high-energy neutrons with 16 energy channels for energy range 0.3–10.0 MeV |
The MGNS has one detector (SCD/G) for gamma rays and four detectors (SD1, SD2, MD and (SCD/N) for neutrons. Additionally, the high-energy neutron detector (SCD/N) is surrounded by anticoincidence plastic scintillator (APS), to protect the sensitive volume of SCD/N from external charged particles. All these detectors are integrated into a single module, which also contains the electronic boards for analog signal processing, HV and LV provision, data storage, logic and interface support.
The choice of neutron detectors is based on our current understanding of the neutron leakage flux from Mercury and on the available heritage of neutron sensors; namely the High Energy Neutron Detector (HEND) onboard NASA's Mars Odyssey (see [Mitrofanov et al., 2002] , [Mitrofanov et al., 2003a] and [Mitrofanov et al., 2003b] ). 3He proportional counters were used for SD1, SD2 and MD. The relevant detection reaction is 3He+n⇒3H+p. These counters are most sensitive to thermal and epithermal neutrons. The counter of SD1 has a surrounding Cd shield, which absorbs all neutrons below the threshold of 0.4 eV. This detector detects epithermal neutrons with the energies above this threshold. The counter of SD2 has no shield and detects both thermal and epithermal neutrons. The difference between counts from SD2 and SD1 corresponds to thermal neutrons. Detector MD is surrounded by a thick polyethylene enclosure inside the Cd shield. An external Cd shield rejects external thermal neutrons, and polyethylene moderates external neutrons epithermal and high-energy neutrons. Due to this moderation, detector MD is sensitive over a higher-energy range in comparison with SD1. Detector SCD/N uses a stilbene crystal for the detection of high-energy neutrons. The detection reaction is n+H⇒n′+p. The stilbene sensor is surrounded by a plastic scintillator, which reject external protons. Light flashes in the stilbene from recoil protons are electronically separated from light flashes from electrons produced by gamma rays. The initial data products from all four detectors SD1, SD2, MD and SCD/N allow the determination of the spectral density of neutron emission over a very broad energy range from thermal energies up to 10 MeV.
The selection of a detector for gamma-ray spectroscopy has been much more difficult. This detector has to simultaneously provide high efficiency and high resolution for the conclusive detection of all major gamma-ray lines emanating from the surface of Mercury. This is an essential prerequisite for testing models (see Table 1). It is well known that any scintillation crystal has worse results for the detection of nuclear lines compared to a high-purity germanium sensor (HP Ge) of similar mass. However, a HP Ge sensor needs an additional system for cryogenic cooling, because it only begins to work as a detector when cooled to below 130 K and preferably at temperatures below 100 K. Also, HP Ge sensors are known to degrade with increasing radiation dose, so one has to provide one more supporting system for annealing, which can heat the crystal up to about 100 °C to remove accumulated radiation damages and to recover the spectral resolution back to the perfection of the original unit. Therefore, there are two essential "overhead" costs, which one has to pay for the perfection of a HP Ge sensor: the mass and power for a cryogenic cooler and the mass and power for an annealing system.
We know that there was no way to build the MGNS instrument with a HP Ge sensor within the allocated mass and power limits of 4.3 kg and 3 W, respectively. In fact, one may expect the mass at least about 8–9 kg for the instrument. Indeed, the mass of the HP Ge gamma-ray spectrometer onboard NASA's Messenger mission is 9 kg (e.g. see Solomon et al., 2007). The largest fraction of this mass is assigned to the active cryogenic cooler. The power for the cooler is related to another limited resource from the spacecraft: to cool Ge sensor, one has to add about 15 W to the currently allocated 3 W for MGNS. Also, one should take into account the necessity of an annealing procedure for the Ge sensor after 6 years cruise flight to Mercury.
Therefore, a scintillation sensor is used for the gamma-ray spectrometer of the MGNS. To obtain the best possible efficiency and spectral resolution, a new innovative scintillation material was used (LaBr3) with a size of 3 in. When the MGNS proposal was selected in 2004, industry had not been able to produce lanthanum halide crystals of this size. However, progress was very fast, and ESA's experts accepted the arguments that crystals of the necessary size would become available in 2007, or earlier. In fact, 3 LaBr3 crystals of the required size were produced for the MGNS in 2007.
We believe that LaBr3(Ce) is the best choice among all existing scintillators because of its high-energy resolution of about 3% at 662 keV, sufficiently good photo-absorption efficiency of about 15% at 6 MeV and very good light collection. The radiation hardness of LaBr3(Ce) has been the subject of space flight tests on the International Space Station (Tret'yakov et al., 2009). No evidence for radiation damage has been found in a test crystal of LaBr3(Ce) after 1 year in orbit. Numerical simulation of count spectrum has been performed for gamma rays from the Mercury surface measured by a Ge sensor and a scintillation sensor based on LaBr3 (Fig. 2). Virtually all nuclear lines, that would be detectable by the Ge sensor, would also be resolved by a LaBr3 sensor. So, we may conclude that the MGNS with a crystal of LaBr3 of size about 8 cm is able to measure spectral data with the necessary quality to accomplish Objective I of this experiment.
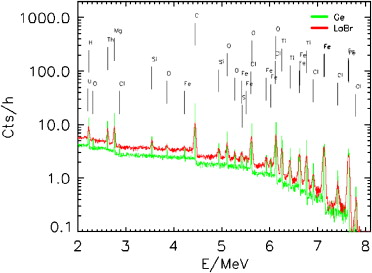
Fig. 2. Simulated energy loss spectra of gamma-ray emission from Mercury. The green shows the calculated spectra measured by a Ge detector of size 6.5×6.5 cm2, while the red line shows the spectra measured by a 300 cm3 LaBr3(Ce) detector.
5. Design of the MGNS instrument
The MGNS design is based on the heritage of the High Energy Neutron Detector (HEND) flown on NASA's "Mars Odyssey" mission. The HEND has successfully operated for more than 7 years in space and has returned more that 3 Gbytes of scientific data. The concept of the MGNS design and its sensors are shown in Fig. 3(a)–(d). A schematic of the MGNS electronics is presented in Fig. 4. It consists of two detection segments: the Mercury Gamma-Ray Spectrometer (MGRS) and the Mercury Neutron Spectrometer (MNS) supported by the Digital and Logic Segment (DLS), which is based on an FPGA. The overall dimensions of the MGNS correspond to 257×342×140 mm3.
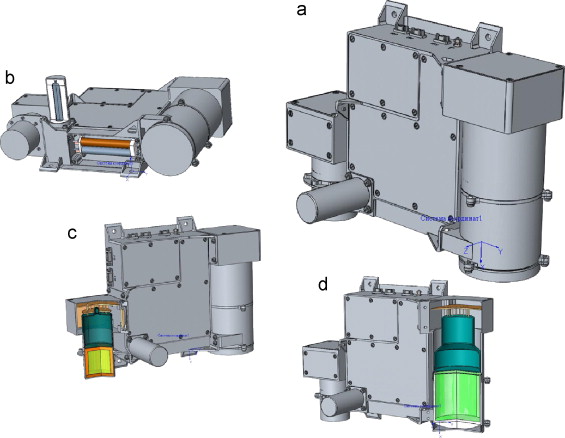
Fig. 3. Schematic views of the MGNS.
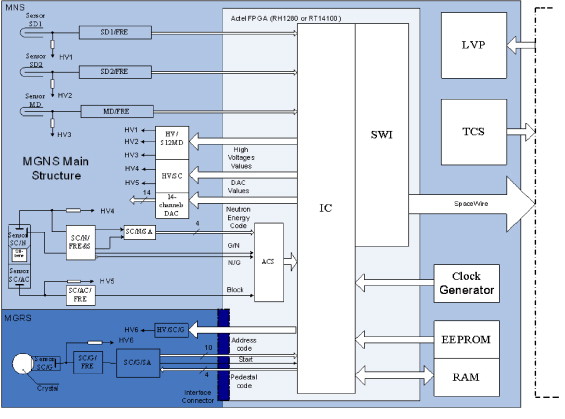
Fig. 4. The main segments and units of the MGNS.
All three detectors SD1, SD2 and MD (Fig. 3(b)) have identical 3He proportional counters and analog electronics. They are based on the HEND prototype elements with counter LND 2517 having a diameter of 12.7 mm, length of 94 mm and pressure of 6 atm. The digitalization of counts allows us to record the well-known two-peak energy spectrum from 3H and p. The energy peak at 764 keV corresponds to full energy deposition of both particles, the low-energy peak at 191 keV corresponds to the energy of 3H only, when a proton escapes from the detection volume. If necessary, one may reject the contribution of low-amplitude noise by a commendable lower-energy threshold. The front-end read-out electronics for SD1, SD2 and MD are quite simple and identical for all three sensors.
The MGNS has two scintillation sensors, SC/N and SC/G (Fig. 3(c) and (d)). The sensor SC/N has a stilbene scintillator. It is also based on the HEND heritage. Recoil protons have randomly distributed energies from 0 up to the total energy of the neutron, En, and produce a scintillation flash in the stilbene. The light is easily detected for energetic protons above energy of -300 keV. The low-energy cut-off of the sensor SC/N is determined by this threshold. The high-energy cut-off is governed by the decreasing cross section of the recoil reaction with increasing neutron energy. We use a cylindrical stylbene crystal of size Ø30×40 cm for detector SC/N. The efficiency curve for neutron detection by the SC/N has a maximum of about a few cm2 around 2.0 MeV.
Electrons, either external, or produced by gamma rays, also generate scintillation light in the stylbene crystal, as well as protons. However, the time profiles of the scintillation flash are quite different for electrons and protons, and a special analog board of the MNS segment separates counts into these two categories. It has a high accuracy for separating electrons and protons with a misidentification of only 1 case in 2000. External cosmic ray protons have also to be separated from recoil protons. Similarly to the design of HEND, a plastic scintillator surrounds the stilbene crystal for the rejection of external protons. An event in the plastic is used for the generation of a veto signal for rejecting cosmic ray events in the stilbene.
The gamma-ray spectrometer of the MGRS (Fig. 3(d)) is based on LaBr3 scintillation crystal with a size of about 8 cm (both in diameter and length). For a spectral resolution of 3% at 662 keV, one would like to have about 8 energy channels over the Gaussian profile of the spectral line. Therefore, events from this sensor are converted into an energy spectrum with 4096 linear channels over the energy range 300 keV–10.0 MeV.
The architecture of the digital and logic segment (DLS) is based on a radiation-resistant Actel FPGA (Fig. 4). The logic of the FPGA is developed in accordance with project requirements and specifications. Low- and high-voltage supply units are operated by the DLS with the possibility of changing the levels of HV by commands. The DLS unit also provides the interface with spacecraft systems for power, thermal control, data readout and commanding.
6. The MGNS instrument capability
A Monte Carlo simulation of gamma-ray emission from Mercury has been performed according to six basic models of surface composition: ChM, ECM, RRM, VRM, the Moon and Mars (Table 1). The flux of the gamma-ray continuum from Mercury has to be combined with the local background from the MPO spacecraft. One cannot know the actual gamma-ray background for the real case of MGNS onboard MPO, until the first data is obtained during the orbital flight around Mercury. However, data from NASA's Mars Odyssey helps to perform qualitative estimations of the continuum, because data from the GRS both before and after deployment are available to the MGNS team. Numerical simulation of the MGNS sensitivity for gamma-ray lines have been performed for a LaBr3(Ce) gamma-ray sensor of volume 300 cm3. The possibility of detecting intrinsic activation lines in the crystal has not been taken into account in this analysis, because it depends on the content of radioactive nuclei in the particular crystal (e.g. see Kernan, 2006). During the development stage of the MGNS instrument a special program of physical measurements will be performed to select the best crystal from a set of available units with minimal radioactive contaminants for the flight instrument, and also to characterize the main intrinsic lines of the instrumental background. The instrument gamma-ray background will also contain lines from materials of the spacecraft itself—so another program of in-flight measurements and numerical simulations will be carried out during the cruise and orbital stage of the mission to determine the energy and intensity of these background lines for their proper exclusion.
Also these simulations did not take into account potential overlapping of several nuclear lines due to close energy values. For example, two lines of Si and U have very close energies of 1779 and 1764 keV, respectively. The overlap will affect the MGNS sensitivity for these lines because of added uncertainties in the evaluated counts for each line. The problem, which is a well-known problem in gamma-ray spectroscopy, will be taken into account at the stage of MGNS data deconvolution, when several different lines for the same element may be analysed together for the most reliable estimation of its content at the surface.
Table 4 represents the estimated detection time tdet for nuclear lines from the major elements on Mercury surface (3σ detection limit) in correspondence with the six basic models of subsurface composition (Table 1). The detection time, tdet, of an individual nuclear line radiated by a particular surface element (pixel) should be compared with the total exposure time, texp, for this pixel. The time, texp, could be evaluated, as the sum of all time intervals, when the MPO flies above the pixel along the predicted elliptical orbit. The mapping stage of MPO is assumed to be 1 Earth year. We assume a pixel size of about 400 km on the surface, which corresponds to the MPO altitude at the pericenter part of the orbit. The exposure time of a pixel depends on its latitude. The shortest exposure time corresponds to pixels near the equator (10 h for a 400 km pixel), and the largest exposure corresponds to poles (193 h for a 400 km pixel).
Table 4. Estimated detection times tdet (3σ significance level, in hours) for major nuclear lines of three ranges if intensity WIR, MIR and BIR in correspondence to the basic testing models of Mercury composition.
| Model | Intensity range | Na 0.44 MeV |
Fe 0.847 MeV |
Ti 0.984 MeV |
Al 1.01 MeV |
Mg 1.34 MeV |
Si 1.78 MeV |
Ca 3.74 MeV |
O 6.13 MeV |
K 1.46 MeV |
U 1.76 MeV |
Th 2.61 MeV |
| ChM | WIR MIR BIR |
16 |
1.5 |
54 |
1.5 |
0.01 |
0.01 |
891 |
0.3 |
12 |
116 |
19 |
| ECM | WIR MIR BIR |
187 |
1.4 |
0.01 |
0.02 |
546 | 0.3 |
48 |
7.7 |
|||
| RRM | WIR MIR BIR |
175 |
0.6 |
0.01 |
0.03 |
464 | 0.3 |
|||||
| VRM | MIR BIR |
15 | 0.08 |
40 | 2.8 |
0.01 |
0.01 |
0.3 |
||||
| Moon | WIR MIR BIR |
22 |
65 |
0.6 |
0.06 |
0.01 |
513 | 0.3 |
0.01 |
0.01 |
||
| Mars | WIR MIR BIR |
5 |
0.04 |
54 |
0.7 |
0.09 |
0.01 |
2292 | 0.3 |
0.01 |
0.6 |
If the detection time tdet for testing nuclear line emission for a particular pixel is smaller than texp for this pixel, it can be measured with a significance of >3σ during the whole period of the mapping stage. On the other hand, if the exposure time of a particular pixel is smaller than the estimated detection time for a line, it can not be measured with a high significance >3σ. One may introduce three ranges of intensity for gamma-ray lines from the surface of Mercury, which corresponding to different levels of detection accuracy by the MGNS. The total time of one Earth year of the orbital mapping phase corresponds to a maximal exposure time texp(max)=8760 h for the entire surface of the planet. The weakest lines with a detection time longer than texp(max) would not be detectable by the MGNS during the one Earth year of the orbital flight.
The exposure time of a polar surface element with a size of 400 km corresponds to texp(pole)=193 h. One may introduce a Weak Intensity Range (WIR) for lines, for which the detection time corresponds to the condition texp(max)>tdet>texp(pole). The lines with the minimal intensity of the WIR could be measured for the entire planet with a significance of about 3σ. On the other hand, lines of the WIR with a maximal intensity could be mapped with 400 km resolution around poles and with worse resolution at moderate latitudes.
The exposure time of a 400 km pixel at the equator is texp(equ)=10 h. The lines from the Moderate Intensity Range (MIR) have a detection time, which corresponds to the condition texp(pole)>tdet>texp(equ). The weakest lines in the MIR could be measured with 3σ significance from a surface element of 400 km at the pole, and brightest >lines could be measured at the same surface elements at the equator. Finally, lines of the Bright Intensity Range (BIR) have a short enough detection time for the condition tdet< texp(equ). These lines could be measured over the entire surface with resolution of 400 km and a high significance >3σ.
The data of Table 4 characterize the scientific performance of the MGNS for the measurement of the main nuclear lines. The detection times are estimated for the different basic models of Mercury subsurface (see Table 1). Due to the different detection times, three different ranges of line intensity correspond to the different mapping capabilities of the MGNS. Summarizing: there is little capability for mapping the emission of lines in the WIR category, except close to the poles. If lines belong to the MIR category, one can create emission maps with a surface resolution of 400 km at the poles and some worse resolution at moderate latitudes. If lines are sufficiently bright and belong to the BIR category, the maps will be created with 400 km resolution over the entire planet.
It is evident from Table 4 that the MGNS measurements of the Fe, Ti, Al and Si lines allow a conclusive comparison between all four test models of Mercury's composition and to distinguish them from Lunar and Martian models. For example, the Al line at 1.01 MeV allows us to distinguish between three groups of models: RRM, VRM and (ChM+ECM). The Fe line at 0.847 MeV is important to selection between the ChM and VRM models. Comparison between the ChM and ECM models could be based on the Si line at 1.78 MeV. The MGNS sensitivity would allow us to resolve surface variations of all these lines with a resolution of about the altitude of the orbit, which varies from 400km up to 1500 km. This should be sufficient for testing particular composition models for large-scale morphological structures on the planet and for testing the composition anomalies along the hot meridians. Measurements of weak Na, Ti and Ca lines may characterize the average composition over the entire surface, but the dynamic ranges of these lines are sufficiently large for different test models, that they could also be useful when comparing the geochemical properties of Mercury, Mars and the Moon.
According to the available data for Mars and the Moon, the lines of the natural isotopes K and Th could be sufficiently strong for mapping with the best possible resolution of about 400 km. Large provinces were found on the Moon with a high content of K and Th, which are interpreted as signatures of the basalt with a high content of KREEP elements (K is potassium, REE is rare earth elements and P is phosphorus). The existence of such provinces is thought to be the result of a huge catastrophic outflow of magma on the young Moon. The same provinces on Mercury could be tested by the MGNS using radioactive isotope data. The most interesting regions for these tests are giant impact craters and longitude strips along the hot meridians.
So, one may conclude that the MGNS has enough capabilities to provide data on the emission of nuclear lines from Mercury, which would be statistically sufficient to accomplish Objective I of this investigation—to determine the best composition models, either for the main geological provinces, or for the entire planet.
To characterize the capability of the MGNS to test for the presence of implanted hydrogen, or water ice deposits and to map the content of hydrogen over the planet, a numerical simulation of the neutron flux from Mercury has been performed using the MCNPX code, assuming the abundance of soil-composing elements according to the Moon model (Table 1). Fig. 5 represents the calculated decrease of the leakage flux of epithermal neutrons for increasing content of hydrogen in the soil (as water equivalent weight %). One can characterize the accuracy of the MGNS measurements of neutrons by the detectable relative variation δF/F of epithermal neutron flux (3σ significance) from a surface pixel of 400 km size.
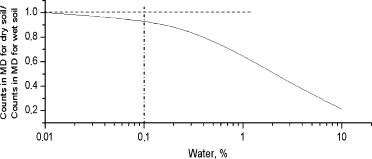
Fig. 5. The measured fractional variation of counts due to epithermal neutrons (δF/F) as a function of water content in the subsurface.
According to numerical simulations of the neutron leakage flux from Mercury, the average flux from the dry surface corresponds to 3.4 counts s−1 of epithermal neutrons and 6.0 counts s−1 of high-energy neutrons. We know from the experience of Mars Odyssey that the local background rate of neutrons from the spacecraft is comparable with the rate of the counts from the planet. Taking into account the estimated exposure time of a pixel of 400 km at the equator, one may conclude that the MGNS has enough capability to map the content of water with accuracy better than 0.1 wt% over the entire surface of the planet with a resolution of about 400 km. The surface deposition of water ice may also be measured by the MGNS with an accuracy of about 0.1 g cm−2 of ice top layer and a surface resolution of about 400 km. The numerical simulation proves that the MGNS satisfies the requirements of Objective II of the project.
NASA has already launched the Messenger mission to Mercury, which will deliver a high-purity germanium gamma-ray spectrometer and neutron detector into orbit around the planet (Solomon et al., 2007). In 2008 the first data on Mercury nuclear line emission is returned to Earth, but the mapping coverage of Mercury will not be complete. Messenger will have highly elliptical, 12 h orbit around Mercury with its pericenter at north polar region. The mission will not be able to provide global coverage of nuclear emission from Mercury, and it will not measure the nuclear data from the south pole region at all.
The MGNS instrument is shown to have necessary capabilities to characterize the elementary composition of the subsurface layer of the entire planet and to test for the presence of water ice deposits at both polar regions of the planet. Data from the MGNS are complementary with data from other instruments onboard Mercury Planetary Orbiter, which constitute a group of instruments for studies of the geochemistry of the subsurface (see Benkhoff, 2009). These are SIMBIO-SYS and MERTIS for mineralogy and MIXS for elemental abundance. The data from BELA (the Mercury laser altimetry) will also be very useful to determine the contours of permanently shadowed polar regions, which are possible cold traps for water vapor deposition. Therefore, the synergy of the suite of MPO science instrumentation will enhance the capability of each particular investigation, so one can be confident that the data from the MGNS will provide an essential contribution to the science output of BepiColombo mission. The MGNS instrument is a Russian-made, Russian-paid contribution of Federal Space Agency to ESA's BepiColombo mission to Mercury.
The MGNS instrument will have a space protoflight. A very similar neutron and gamma-ray spectrometer (HEND NS) will be installed onboard the Russian spacecraft "Phobos-Grunt" for a Phobos landing and soil return. The HEND NS instrument will have essentially the same set of neutron sensors as the MGNS. The only difference is that its gamma-ray spectrometer will be a down-scaled version of the MGNS one. A LaBr3 crystal of 2 in will be used for HEND NS in comparison with a 3 in crystal used for the MGNS. The main measurements of the HEND NS will be performed on the surface of Phobos, when the exposure time at the landing site could be as long as the time of surface operations. Therefore, the smaller sensitivity of the HEND NS gamma-ray detector for the HEND NS will be offset by the much longer exposure time for measurements of the gamma-ray spectrum.
Experiments with the HEND NS will allow the main design elements of the MGNS to be tested in the conditions of space flight. The scheduled "Phobos-Grunt" launch date of October 2009 still allows us to take into account any design issues or peculiarities of the HEND NS operations, which could be faced during the first period of space flight of the HEND NS. The data from these two similar experiments would be very useful for a direct comparison of the elemental composition of Mercury and Phobos. Differences and/or similarities in elemental abundances of these two bodies, together with the available data for the Moon and Mars, will allow us to make an important step in the understanding of the origin and evolution of celestial bodies in the internal part of the Solar System.
The authors are thankful to Drs. Benkhoff, Bodo Gramkow, Marc Schwetterle together with all other professional people of the team of the Mercury Planetary Orbiter of ESA BepiColombo mission, who closely cooperated with us throughout the process of instrument design and development. We also wish to acknowledge the anonymous referees of this paper for very valuable comments and suggestions. The part of this work was supported by the Russian Foundation for Basic Research (Grant 08-08-90473).
Adler et al., 1969 I. Adler et al., Earth, Moon and Planets, 7 (1969), p. 487.
Basaltic Volcanism Study Project: Basaltic Volcanism on the Terrestrial Planets, 1981 Basaltic Volcanism Study Project: Basaltic Volcanism on the Terrestrial Planets, 1981. Geophysical and Cosmochemical Constraints on Properties of Mantles of the Terrestrial Planets. Pergamon Press, Oxford, pp. 634–699 (Chapter 4).
Benkhoff, 2009 J. Benkhoff. Planetary and Space Science, 56 (2009), pp. 2–20.
Boynton et al., 2002 W. Boynton et al., Science, 297 5578 (2002), pp. 81–85.
Boynton et al., 2004 W. Boynton et al., Space Science Reviews, 110 1 (2004), pp. 37–83.
Boynton et al., 2007 W. Boynton et al., Journal of Geophysical Research, 112 E12 (2007).
Dolginov, 1988 A.Z. Dolginov. Physics Reports, 162 6 (1988), pp. 337–416.
Fegley and Cameron, 1987 B. Fegley and A. Cameron, Earth and planet. Science Letters, 82 3–4 (1987), pp. 207–222.
Feldman et al., 1998a W. Feldman et al., Science, 281 (1998), p. 1489.
Feldman et al., 1998b W. Feldman et al., Science, 281 (1998), p. 1496.
Feldman et al., 2002 W. Feldman et al., Science, 297 5578 (2002), pp. 75–78.
Goettel, 1988 K. Goettel, F. Vilas, C.R. Chapman, M.S. Mathews, Editors, Mercury, University of Arizona Press, Tucson (1988), pp. 613–621.
Harmon, 1997 J. Harmon. Advances in Space Research, 19 (1997), p. 1487.
Kernan, 2006 W.J. Kernan. IEEE Transactions on Nuclear Science, 53 1 (2006).
Lawrence et al., 1998 D. Lawrence et al., Science, 281 (1998), p. 1484.
Mitrofanov et al., 2002 I. Mitrofanov et al., Science, 297 5578 (2002), pp. 78–81.
Mitrofanov et al., 2003a I. Mitrofanov et al., Science, 300 (2003), pp. 2081–2084.
Mitrofanov et al., 2003b I. Mitrofanov et al., Solar System Research, 37 5 (2003), pp. 366–377.
Mitrofanov and et al., 2004 Mitrofanov, I., et al., 2004. In: 35th Lunar and Planetary Science Conference, March 15–19, League City, Texas, abstract no.1640.
Morgan and Anders, 1980 J. Morgan and E. Anders, Chemical composition of Earth, Venus, and Mercury. Proceedings of the National Academy of Sciences United States of America E—Physical Sciences, 77 (1980), pp. 6973–6977.
Nozette et al., 1996 S. Nozette et al., Science, 274 (1996), p. 1495.
Prettyman et al., 2006 T. Prettyman et al., Journal of Geophysical Research, 111 E12 (2006).
Siegfried and Solomon, 1974 R. Siegfried and S. Solomon. Icarus, 23 (1974), p. 192.
Solomon et al., 2007 S. Solomon et al., Space Science Reviews, 131 1–4 (2007), pp. 3–39.
Sprague et al., 1995 A. Sprague et al., Icarus, 118 (1995), pp. 211–215.
Tailor et al., 2006 J. Tailor et al., Journal of Geophysical Research, 111 E3 (2006).
Tret'yakov and et al., 2009 Tret'yakov, V., et al., 2009. Kosmicheskie Issledovaniya (in Russian), in press.
Vinogradov et al., 1966 A. Vinogradov et al., Space Research, 4 (1966), p. 871.
Wänke et al., 2001 H. Wänke et al., Space Science Review, 96 (2001), pp. 317–330.
