")
")
Search for Traces of Chemically Bound Water in the Martian Surface Layer Based on HEND Measurements onboard the 2001 Mars Odyssey Spacecraft
A. T. Basilevsky1, M. L. Litvak2, I. G. Mitrofanov2, W. V. Boynton3, R. S. Saunders4, and J. W. Head5
1Vernadsky Institute of Geochemistry and Analytical Chemistry, Russian Academy of Sciences, ul. Kosygina 19, Moscow, 119991 Russia
2 Space Research Institute, Russian Academy of Sciences, Profsoyuznaya 84/32, Moscow, 117997 Russia
3 Lunar and Planetary Laboratory, University of Arizona, Tucson, AZ 85721, USA
4Jet Propulsion Laboratory, Pasadena, CA 91109, USA
5Department of Geologic Sciences, Brown University, Providence, Rhode Island, 02912 USA
Abstract - Analysis of the distribution of the epithermal and fast neutron fluxes from the Martian surface within the ±60° latitude zone measured by the High-Energy Neutron Detector (HEND) from mid-February through mid-June 2002 has revealed regional neutron-flux variations outside the zones of climatic effects, which appear to be attributable to the presence of chemically bound water. With the exception of the epithermal neutron fluxes in Arabia and southwest of Olympus Mons (Medusae Fossae), these variations show no correlation with the geologic structure of the terrain at the level of global geologic maps. The lack of such a correlation probably implies that to the formation depth of the epithermal neutron flux (1–2 m), let alone the fast neutron flux (20–30 cm), much of Mars is covered by a surface material that bears little relation in composition to local bedrocks. Clearly, this is an aeolian cover whose fine-grain component was mixed by dust storms in the geologic time on the scale of large regions. The decrease in the flux of epithermal neutrons in Arabia and southwest of Olympus Mons (Medusae Fossae) appears to be attributable to an enhanced concentration of materials containing chemically bound water (clay minerals, palagonite, hydroxides, and hydrosalts) in the surface layers of these regions.
DOI: 10.1023/A:1026022912786 - http://www.springerlink.com/content/x590p2195r1098jr/
-------------------------------------------------------------------------------------------------------------------------------------------------
WHAT WAS KNOWN ABOUT BOUND WATER IN THE MARTIAN MATERIAL BEFORE THE MARS
ODYSSEY NEUTRON MAPPING
The US 2001 Mars Odyssey spacecraft is currently orbiting Mars. Its scientific payload includes the Russian-made High-Energy Neutron Detector (HEND) (Mitrofanov et al., 2002a). The latter is part of the nuclear-physical instrumentation, which also includes the US Neutron Spectrometer (NS) operating at lower energies (Feldman et al., 2002) and the US Gamma-Ray Spectrometer (GRS) (Boynton et al., 2002). The HEND and NS instruments measure the neutron flux from the Martian surface produced by cosmic-ray bombardment of the surface. This flux strongly depends on the abundance of hydrogen in the surface material whose nuclei decelerate the neutrons colliding with them. Thus, the HEND and NS instruments obtain data on the abundance of hydrogen in the Martian surface layer, which is in the form of free (ice) or physically and chemically bound water (Mitrofanov et al., 2002a, 2002b; Mitrofanov et al., 2003; Litvak et al., 2002a, 2002b; Litvak et al., 2003).
The HEND data analyzed here were obtained from mid-February (Ls= 329°) through mid-June 2002 (Ls=27.5°). This period is twice as long as the accumulation time of the data analyzed by Mitrofanov et al. (2002a). This first publication and the accompanying papers by Boynton et al. (2002) and Feldman et al. (2002) describe the well-defined latitudinal zonality: a low neutron flux (due to the presence of ice on the surface and in the soil) at high latitudes and a much higher neutron flux (no ice) at middle and low latitudes. This zonality was found to be disrupted in two large regions located at low and middle latitudes, Arabia Terra and the region southwest of Olympus Mons. An anomalously low neutron flux was measured here. The nature of these anomalies was explained in general terms, more specifically, by "geographic variations in the amount of chemically and/or physically bound Н2О and/or OH… (Feldman et al., 2002).
Three forms of the thermodynamically stable existence of water are known to be possible on and near the Martian surface: (1) physically bound (adsorbed) water, (2) water ice, and (3) chemically bound water (Н2О and OH). Judging by laboratory experiments (Zent and Quinn, 1995) and measurements at the Viking-1 and -2 landing sites (Biemann et al., 1977), which are discussed below in more detail, the mass fraction of adsorbed water in the Martian surface material is unlikely to be higher than 0.1–0.2%. Clearly, the presence of water ice and minerals containing chemically bound water on the surface and in the near-surface layer are responsible for the observed variations in the neutron flux from the Martian surface. The presence of water ice is controlled by the water-vapor temperature and partial pressure, i.e., by climatic and weather factors. The latter, in turn, depend on the geographic latitude and elevation of the terrain, the season, and, on a long-term scale, the inclination of the rotation axis of Mars to its orbital plane. The presence of minerals containing chemically bound water is determined by the possibility and efficiency of the chemical reactions of their formation at the current and previous geologic epochs. At the low temperatures characteristic of the Martian surface, water-containing minerals can be preserved for a geologically long time. Thus, they can be an indicator of the natural environment at past epochs.
In this paper, we analyze the HEND data with the emphasis placed on the geologic interpretation of the neutron-flux variations over the area and attempt to separate effects attributable to the presence or absence of free water (ice) from effects resulting from the possible presence of (physically and chemically) bound water in the Martian surface material.
WHAT WAS KNOWN ABOUT BOUND WATER IN THE MARTIAN MATERIAL BEFORE THE MARS ODYSSEY NEUTRON MAPPING
In attempting to find evidence of bound water in the HEND data, we must consider what is already known about bound water in the Martian material. This information includes data from the Viking-1 and -2 experiments aimed at searching for life on Mars, the complementary results of laboratory experiments on Н2O and CO2 adsorption under typical Martian surface conditions, the continuing interpretation of the data obtained with the APXS spectrometer at the Mars Pathfinder landing site, and data on the composition of Martian meteorites.
Viking-1 and -2, Data. Apart from other instruments, the Viking-1 and -2 biological experiment included a gas chromatograph–mass spectrometer (Biemann et al., 1977). This instrument measured the water content in two samples at each of the two landing sites. At the Viking-1 landing site (Chryse Planitia, 22.482° N, 312.032° E; Arvidson et al., 1989), one of the analyzed samples was taken from a depth of 4–6 cm, while the other was taken from the surface. At the Viking-2 landing site (Utopia Planitia, 47.996° N, 134.264° E; Arvidson et al., 1989), one of the analyzed samples was the surface crust material, while the other was taken from under a 20-cm stone. The samples were heated stepwise, and the released gases were analyzed.
Measurements showed that the samples lost little water at 200° and released significant and approximately equal amounts of water at 350 and 500° (Biemann et al., 1977). This result implies that the samples contained relatively low concentrations of adsorbed water (released at 200°) and higher concentrations of chemically bound water (released at 350 and 500°). The measured mass fractions of adsorbed water were < 0.1 and 0.05–0.2% for the Viking-1 and -2 landing sites, respectively. The measured mass fractions of chemically bound water were 0.1–1.0% for the first sample and 0.3–3.0% for the second sample for Viking 1 and, respectively, ~1.5% and ~1.9% for Viking 2.
It should be noted, however, that the accuracy of these measurements is low. The mass spectrometer used in this experiment was aimed mainly at analyzing the microscopic amounts of organic compounds. Therefore, when a relatively large amount of water vapor was released during sample heating, there was a risk of overloading the pump. To avoid this overloading, the vapor was not analyzed but was released into the Martian atmosphere (Biemann, 1979). The amount of released water was estimated subsequently, in the laboratory, by injecting various amounts of water into the model of the instrument and comparing the behavior of the laboratory instrument with the telemetry data on the operation of the instrument on Mars. Biemann (1979) argues that, for this reason, all of the above estimates for the absolute water contents in the samples analyzed by Viking 1 and 2 are probably correct only to within a factor of 5 (in both directions), but the relative accuracies of the estimates are much higher. Therefore, the fact mentioned above that the content of adsorbed water in the analyzed samples is much lower than the content of chemically bound water is beyond question.
Laboratory Experiments and Their Interpretation. Zent and Quinn (1995) measured the individual and joint adsorptions of CO2 and Н2О on a palagonite analogue of the Martian soil. In particular, they found that for T = 210 K, P(CO2) from 1.9 to 7 mbar, and P(Н2О) = 0.1 μbar, the amount of adsorbed water was about 0.2–0.3 mg/g (0.02–0.03%). For P(CO2) from 8 to 9 mbar and P(Н2О) = 4.7 μbar, the amount of adsorbed water was about 0.8–2 mg/g (0.08–0.2%).
The Н2О partial pressure within almost the entire ±60° latitude belt varies between 0.5 and 2 mbar during the Martian year and reaches 3–4 μbar only in midsummer in the latitude band 30°-60° N (Jakosky and Haberle, 1992). Viking 1 measured the water content in the soil samples at the very beginning of northern summer (typically, P(Н2О) = 1–1.5 μbar). The first sample was taken on Martian day 8 after the landing, when the daily mean surface temperature was about 210 K; the second sample was taken on day 31, when the daily mean temperature was 212 K (Biemann et al., 1977). Viking 2 measured the water content in the samples in northern mid-summer (typically, P(Н2О) = 3 μbar). The first sample was taken on Martian day 21 after the landing, when the daily mean surface temperature was about 218 K; the second sample was taken on day 37, when the daily mean temperature was about 215 K. The higher Н2О partial pressure (favors water adsorption) at the Viking-2 landing site may have been balanced by the higher surface temperature (does not favor water adsorption), which probably explains the approximately equal contents of adsorbed water in the Viking-1 and -2 samples.
Mars Pathfinder Data. The continuing processing of the APSX chemical-composition measurements of soils and rocks at the Mars Pathfinder landing site (19.13° N,326.78° E) has yielded estimates of the bound-water contents in the objects under study (Foley et al., 2001; Foley, 2002). Analysis of the alpha-proton backscattering data revealed an excess of oxygen that is not bound into the oxide composition model even if all of the iron and sulfur are represented as Fe3+ and S6+, respectively. The authors suggest that excess oxygen is incorporated into chemically bound water in soil and rock minerals. This suggestion is also supported by the APXS X-ray–fluorescent data. Although hydrogen cannot be directly determined in X-ray–fluorescent (as well as alpha-proton) measurements, if water is present in the material under study, then the spectral band intensity decreases proportionally to the amount of water. It turned out that the objects of measurements in which the alpha–proton method revealed the largest excess of oxygen exhibited a low X-ray photon count rate in X-ray–fluorescent measurements. As a result, the mass fractions of bound water could be estimated, from < 0.5 to 7 % of Н2О, depending on the assumed valent states of iron and sulfur in the material under study (Foley et al., 2001; Foley, 2002). According to these estimates, the Н2О content in soil (< 0.5–3%) is systematically lower than that in rocks (0.5–7%). The authors of this paper believe that Н2О in the material at the Mars Pathfinder landing site is in the form of hydroxides.
SNC Meteorites. SNC meteorites are yet another source of information about bound water in the Martian material. Obviously, these meteorites are the fragments of ejections from recently formed large impact craters on Mars that reached the Earth. These include the fragments of impact-metamorphized magmatic rocks (basalts, pyroxenites, peridotites) with traces of secondary postmagmatic alterations, which give an idea of the fluids that caused these alterations (Bridges et al., 2001). There are relics of amphibole-containing magmatic melts among the magmatic components of these rocks. Amphibole contains chemically bound water (in the form of an OH anion), suggesting that the melts from which these rocks were crystallized were not anhydrous. The secondary components of SNC meteorites account for up to 1% by volume. They are represented by the Fe, Mg, and Ca carbonates, anhydrite, halite, gypsum, and clays (smectite and illite).
The low contents of secondary minerals in SNC meteorites and the preservation of water-soluble salts among them for a geologically long time are indicative of the small scales of the secondary alterations by water fluids. The secondary minerals are believed to have been formed under the effect of brines similar in composition to seawater, which were weakly acid, contained many carbonates, and occasionally seeped into igneous rock massifs through regolith (Bridges et al., 2001). The scales of the secondary water alterations at or near the Earth's surface in regions of magmatic activity are much larger, but they are known to greatly decrease with depth. Therefore, depending on which parts of the Martian magmatic massifs (near-surface or deep ones) the SNC meteorites under study originate from, the above properties of their secondary components can be either an indication of the limited secondary water processing scales or simply a natural result of the decrease in water activity with depth.
Thus, the foregoing leads us to conclude that within the latitude zone where no water ice is expected to be present on the surface and in the soil, the variations in the neutron flux from the Martian surface will be mainly determined by variations in the contents of chemically bound water. The contents of adsorbed water appear to be less than 0.1–0.2%, which is below the HEND sensitivity threshold (Mitrofanov et al., 2002a, 2002b).
A General Approach to Analysis. Since the HEND data themselves carry no information about the form in which the hydrogen affecting the neutron flux is, we may try to find traces of bound water by studying the measurements in regions where the presence of water ice seems to be impossible. These include regions at low (in any season) and middle (in summer) latitudes. If the HEND above these regions shows a low neutron flux, then this may be considered evidence for the presence of bound water.
This approach is based on the study by Farmer and Doms (1979). Assuming that the water frost condensation temperature on Mars is 198 K (a well mixed atmosphere containing 12 μm of precipitated water) and using the mean surface albedo and surface-layer thermal inertia for this planet in their calculations, these authors determined where and when the subsurface temperature on Mars drops below the condensation point. Thus, they estimated the stability of water ice from the surface to a depth of 10 m and found that water ice at these depths is almost always unstable within the ±40° latitude zone. Only during the transition from autumn to winter in the northern and southern hemispheres, for depths from 5 to 50 cm, do the latitudinal boundaries of ice instability narrow to latitudes of ~30° N and ~20° S, respectively, while above and below this range of depths, ice is unstable within the entire ±40° belt.
Subsequently, Paige (1992) showed that the albedo and thermal inertia on Mars widely vary and that, other things being equal, the annual subsurface temperature must be lower where the soils have a lower thermal inertia. Therefore, ground ice in regions with a low thermal inertia must be stable at latitudes lower than those of regions with a high thermal inertia. Taking the ice condensation temperature to be 203 K, Paige (1992) concluded that ground ice can be stable almost everywhere.
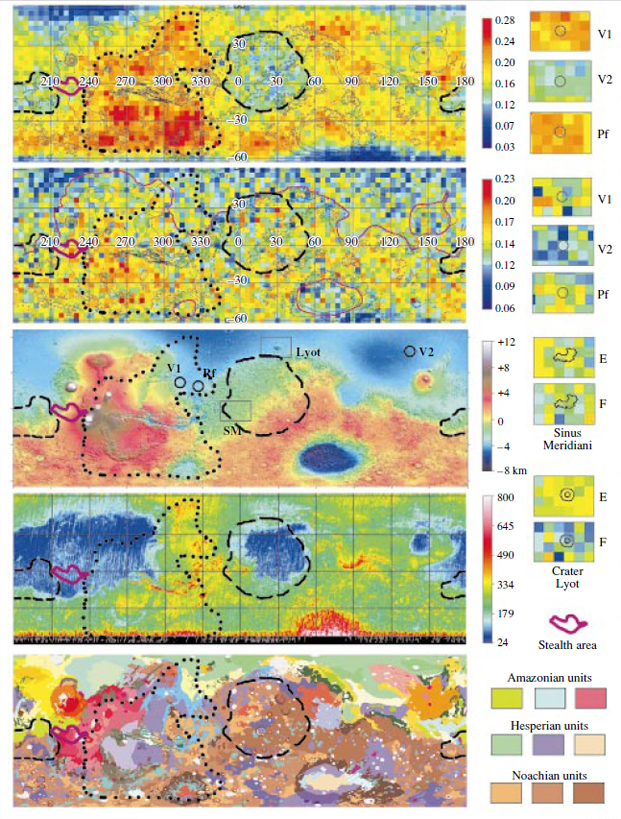
On the left (from the top downward): the epithermal and fast neutron maps, the (MOLA) elevation map, the (TES, J m2 K s1/2) thermal inertia map, and the geologic map for the ±60° latitude zone. On the right: at the top, the epithermal neutron maps for the Viking-1 (V1), Viking-2 (V2), and Mars Pathfinder (PF) landing sites; in the middle, the fast neutron maps for the landing sites of the same spacecraft; and at the bottom, the epithermal (E) and fast (F) neutron maps for the region of hematite deposits in Sinus Meridianiand (SM) and the Lyot Crater (Lyot). The map pixel is 4°x4° for all neutron maps.
Mellon and Jakosky (1993, 1995) further developed the model by Paige (1992). In their calculations, these authors used the albedo and thermal inertia typical of specific regions and determined the yearly mean temperatures as a function of these parameters, the location of the region, and the inclination of the Martian rotation axis. They found that the ice stability boundaries are close to those obtained by Farmer and Doms (1979) for the current inclination (25.19°), ice is unstable within almost the entire ±60° latitude band for a smaller inclination (19.55°), and ground ice is stable over the entire planet for inclinations larger than 30°.
Thus, calculations show that the proposal to search for evidence of bound water in low- and mid-latitude regions is quite acceptable, but local variations in albedo and thermal inertia can complicate the picture and make alternative interpretations possible. Below, we analyze the neutron-flux distribution in area within the ±60° latitude zone. This zone includes the ±40° latitude belt where there is apparently no ice, at least in summer (Farmer and Doms, 1979; Mellon and Jakosky, 1993, 1995) plus additional (from the poles) 20°-wide belts where there is hope to also see evidence of bound water in the favorable season. For the subsequent analysis, it is important to note that the data considered here were obtained when the areocentric longitude of the Sun was from 345° (the end of northern summer) to 27.5° (the first third of northern spring).
Epithermal Neutron Fluxes in the ±60° Latitude Zone. In this zone, latitudinal zonality shows up only at longitudes 120°-300° E at the northern boundary of the zone and further south up to 30°-40° N and at longitudes 30°-180° E at its southern boundary and further north up to 45°-50° S (see the figure). In these latitude belts, the epithermal neutron flux increases from the zone boundaries equatorward from 0.04–0.10 to 0.12–0.15 counts/s. Within the ±60° zone, we also clearly see the two regions with an anomalously low neutron flux (0.10–0.15 counts/s) mentioned above. One region, round in the plane of the sky, lies northwest of the Hellas Basin, stretching from about 30° S to 40° N and from 350° E to 50° E (Arabia Terra). The other, latitudinally elongated region lies southwest of Olympus Mons, stretching from 20° S to 15° N and from 160° E to 220° E. The very large region stretching from almost 60° S to 60° N and from 250° E to 330° E is characterized by a relatively high epithermal neutron flux (0.20–0.26 counts/s) with local maxima in the northern part of the Argyre Basin and further north and within Solis Planum. The remaining part of the ±60° latitude zone, which is more than half of it, is mainly characterized by intermediate neutron fluxes (0.15–0.19 counts/s) with sporadic lower and higher values.
As we see from the figure, the observed distribution of epithermal neutron fluxes exhibits no correlation with the surface elevation. The highest volcanoes on the planet in the Tharsis region do not differ in epithermal neutron flux from the neighboring lower areas. The negative anomaly of Arabia Terra lies in a region with elevations from -1 to +3 km above the average surface level of the planet. The region with a low neutron flux southwest of Olympus Mons has elevations from –1 to +2 km. The region of high epithermal neutron fluxes (60° S–60° N, 250°-330° E) has elevations from –2 to +5 km. Within the remaining part of the ±60° latitude zone, no correlation is observed between the epithermal neutron flux and the terrain elevation either.
The distribution of epithermal neutron fluxes occasionally correlates with the geologic structure of the terrain (see the figure). This is true for the regions of Arabia Terra and southwest of Olympus Mons with low epithermal neutron fluxes. These two regions are geographically antipodal. Schultz and Lutz (1988) pointed out that they are characterized by the presence of loose deposits easily erodible by wind, which may be an analogue of the currently observed polar layered deposits of this planet (Scott and Carr, 1978; Tanaka and Scott, 1987). These authors assumed that these are relics of the deposits of the ancient Martian polar caps. Southwest of Olympus Mons, these deposits during geologic mapping were separated into the Amazonis formation of Medusae Fossae (Scott and Tanaka, 1986). Within Arabia Terra, this material was not separated into a geologic units on the published global geologic maps (Scott and Carr, 1978; Greeley and Guest, 1987). However, Schutz and Lutz (1988) mapped here large areas of a stripped terrain and a terrain of the same type within the Medusae Fossae formation.
In most cases, however, no correlation was found between the epithermal neutron fluxes and the units shown in the global geologic maps (Scott and Carr, 1978; Greeley and Guest, 1987; Tanaka and Scott, 1987). A digital version of the combined geologic map of Mars compiled by K. Tanaka from these three global maps is shown in the figure. The large region with high epithermal neutron fluxes mentioned above includes very heterogeneous geologic units: Noachian cratered, hilly, and etched units (these mainly include megaregolith breccia formed more than 3.7 billion years ago), Hesperian plains with ridges and the Syria Planum formation (lavas with an age of 3.0–3.7 billion years), and the Amazonian formation of Tharsis Montes (lavas younger than 3.0 billion years) (Scott and Tanaka, 1986; Hartmann and Neukum, 2001). The same geologic units are also located outside this positive anomaly in regions with intermediate epithermal neutron fluxes.
The distribution of epithermal neutron fluxes in the ±60° latitude zone under consideration occasionally correlates with the surface thermal inertia (see the figure). Thus, the anomaly of Arabia Terra largely coincides with the region of low thermal inertia on the map compiled by Mellon et al. (2000) from the TES imaging of Mars. The northern half of the epithermal neutron flux anomaly southwest of Olympus Mons coincides with the southern edge of the vast region of low thermal inertia highlighted on this map. These coincidences seem quite natural in light of the loose constitution of the Medusae Fossae material and its analogues in Arabia Terra. However, the southern part of the neutron flux anomaly southwest of Olympus Mons lies outside the region of low thermal inertia, and low epithermal neutron fluxes are not characteristic of the region of low thermal inertia further north. The southern part of the vast zone with high epithermal neutron fluxes (the north of Argyre Basin and Solis Planum) and the northern part of this zone coincide with the regions of relatively high thermal inertia. However, the latter extend further to the region with intermediate epithermal neutron fluxes. In turn, the regions with intermediate epithermal neutron fluxes are characterized not only by high thermal inertia but also by intermediate and low values.
Fast Neutron Fluxes in the ±60° Latitude Zone. The geographic distribution of fast neutron fluxes in this zone markedly differs from that for epithermal neutrons. The first difference is that, whereas low epithermal neutron fluxes in the northern part of this zone wereobserved only at longitudes 180°-280° E and were close to a latitude of 60° N, low fast neutron fluxes are characteristic of all longitudes of the northern part of the ±60° zone and extend far southward. The southern boundary of this region with low fluxes follows a surface elevation from approximately –1 to –2 km rather than a certain latitude (see the figure). As a result, the boundary of the region with low fluxes extends far southward in the ranges of longitudes 200°-240° E and from 330° to 20° E and northward in the range of longitudes 240°-300° E. This boundary roughly corresponds to the well-known dichotomy boundary, which separates hypsometric low northern plains from cratered and volcanic highlands in the south of the planet. Within this region of low fast neutron fluxes, there is a tendency for the fluxes to decrease northward, against the background of which sporadic variations toward higher and lower values are observed. Fluxes from 0.10 to 0.13 counts/s and from 0.13 to 0.15 counts/s are characteristic of the northern part of this region with low fluxes and the part closer to its southern boundary, respectively.
The second difference between the geographic distributions of epithermal and fast neutron fluxes is associated with the Hellas Basin in the south of the zone (see the figure). A low fast neutron flux (0.06– 0.14 counts/s) was recorded within this basin, while the epithermal neutron flux here varies between intermediate and high values. An extended zone of low fast neutron fluxes that spatially coincides with the zone of low epithermal neutron fluxes passes south of the Hellas Basin and further eastward along a latitude of 60° S. The region of low fast neutron fluxes inside Hellas mainly has elevations lower than about –1 km, with the elevations being lower than –5 km in most of it. This region may be considered as an equatorward protrusion of the zone with low fast neutron fluxes extending along a latitude of 60° S. This protrusion coincides with the topographic depression, and this situation resembles in elevation control the situation in the northern part of the ±60° zone. It should be noted, however, that no such elevation control is observed within the Argyre Basin. In comparison with the neighboring higher terrain, the central part of this basin (elevations from –1 to –4 km) exhibits no systematically lower fast neutron fluxes.
The third difference shows up in the regions of Arabia Terra and southwest of Olympus Mons. Arabia Terra, which clearly stands out among its surroundings by low epithermal neutron fluxes, exhibits no appreciable fast neutron flux anomaly (see the figure). The region southwest of Olympus Mons exhibits an indistinct decrease in the flux of fast neutrons. However, we see no correlation between the epithermal and fast neutron fluxes here at the pixel level of the map being analyzed (4°x4°).
The fourth difference shows up in the vast terrain from 60° S to 60° N and from 250° E to 330° E, where the epithermal neutron flux is appreciably enhanced, while the fast neutron flux exhibits no comparable enhancement. An appreciable increase in the flux of fast neutrons (0.16–0.23 counts/s) is observed only in a relatively small part of this terrain, within Solis Planum.
Outside the northern plains and the bottom of the Hellas Basin with low fast neutron fluxes and Solis Planum with high fluxes, the fast neutron flux typically varies between 0.15 and 0.17 counts/s, with sporadically scattered higher and lower values.
Neutron Fluxes at the Viking-1, Viking-2, and Mars Pathfinder Landing Sites in the Region of Hematite Deposits in Sinus Meridiani, Near the Lyot Crater, and in the Stealth Region. As was described above, the contents of bound water in the surface material were determined at the Viking-1, Viking-2, and Mars Pathfinder landing sites, and, naturally, it would be of interest to correlate them with the neutron fluxes measured for these sites by the HEND. In addition, the Viking-1 and Mars Pathfinder landing sites are on the hypsometrically low Chryse Planitia, which is believed to have been the gulf of the Martian northern ocean in the geologic past (see, e.g., Baker et al., 1991; Clifford, 1993). Therefore, it would be natural to expect the presence of substances containing bound water here. Sinus Meridiani is a place where, judging by TES data, accumulations of gray crystalline hematite, which is believed to have been formed in a water environment, are located on the surface (Christensen et al., 2001). Hence, it would be also natural to expect the presence of substances containing chemically bound water here. The Lyot Crater is a relatively young (Amazonian) crater. It is large enough (D = 215 km) to excavate material from the depth where one might expect not ice but liquid water to be present. Liquid water must react with the rocks in whose voids it is contained. Therefore, it would be natural to expect an appreciable amount of chemically bound water in the ejecta of this crater. Finally, the Stealth region is an extended (700x1800 km) terrain south of Olympus Mons, which does not reflect a radar signal from the Earth distinguishable against the noise background (Muhleman et al., 1991; Edgett et al., 1997). The name of this region, Stealth, originates from the name of the bomber invisible for radars. The low reflectance of the Stealth region in the radio frequency range is believed to stem from the fact that a layer of loose, low-density fine-grain material is located on the surface here. This layer is 1 to 3 m and, most likely, no less than 5 m in thickness; i.e., this is the layer the epithermal neutron flux from which is recorded by the HEND, and, naturally, it would be of interest to look at this flux here.
The Viking-1 landing site in the western part of Chryse Planitia (22.482° N, 312.032° E) is located in the northern part of the zone with a high epithermal neutron flux mentioned above. This flux was 0.18–0.20 counts/s here, while the fast neutron flux was 0.12–0.14 counts/s. We clearly see from the figure that during the accumulation of HEND data (from the end of northern winter until the beginning–middle of northern spring), the Viking-1 landing site was in the zone of seasonal moistening that affects the uppermost part of the soil here. This moistening showed up in the fast neutron flux and did not show up in the epithermal neutron flux. The former appears to be largely determined here by seasonal moisture, although bound water is also present here in appreciable amounts, as strongly suggested by the analyses of the soil samples taken from the surface and from a depth of 4–6 cm (Biemann et al., 1977). The epithermal neutron flux here appears to be mainly determined by the presence of chemically bound water, but in amounts no larger than those in most of the other Martian regions.
The Viking-2 landing site in Utopia Planitia (47.996° N, 134.264° E) is farther from the equator, i.e., deeper in the zone of northern seasonal moistening. Here, both the epithermal neutron flux (0.12–0.14 counts/s) and the fast neutron flux (0.10–0.13 counts/s) are appreciably lower than their values characteristic of regions outsidethe zones of seasonal moistening (the figure). The former and, to an even larger degree, the latter are mainly determined here by seasonal moisture. At the same time, the contribution of chemically bound water is of secondary importance here, although, as analyses of samples at this site (the surface crust and the soil under a 20-cm rock show, it is not very small (Biemann et al., 1977).
The Mars Pathfinder landing site in the southeastern part of Chryse Planitia (19.13° N, 326.78° E) is relatively close (900 km to the southeast) to the Viking-1 landing site and, as the latter, is located in the northern part of the zone of enhanced epithermal neutron fluxes mentioned above (the figure). Its value here is 0.18–0.20 counts/s. The fast neutron flux here is 0.13–0.15 counts/s, which is slightly lower than its typical values outside the zones of seasonal moistening. The latter, as in the case of Viking 1, affected the uppermost part of the soil; the fast neutron flux here is probably also determined mainly by seasonal moisture, although, as APXS data show (Foley et al., 2001; Foley, 2002), the contribution of chemically bound water here is not small either. The epithermal neutron flux in this region appears to be mainly determined by the presence of chemically bound water. Since the epithermal neutron flux here is higher than that in most of the other Martian regions, one may think that the content of bound water here is lower rather than higher than that in most of the other Martian regions.
The gray crystalline hematite deposits in Sinus Meridiani occupy an area of no less than 175000 km2. The volume content of hematite in this body is estimated to be 10–15%. The center of this geologic body has the following coordinates: 2° S and 357° E (Christensen et al., 2001b). This is the western periphery of the region with low epithermal neutron fluxes in Arabia Terra (see the figure). The epithermal neutron flux typically varies between 0.12 and 0.17 counts/s in this part of Arabia Terra and between 0.15 and 0.17 counts/s within the hematite deposit contour. The fast neutron flux here is 0.15–0.17 counts/s, i.e., the same as that in most of the planet outside the regions of seasonal moistening. In general, we failed to find any change in the neutron fluxes confined to the hematite deposits of Sinus Meridiani.
The Lyot Crater (D = 215 km, 50.8° N, 29.3° E) lies within the Vastitas Borealis (see the figure). It was studied by Russell and Head (2002) in the hope of seeing morphological evidence that the crater exposed an aquifer below the permafrost zone, but they saw no evidence of this. The bottom of this crater is about 3 km lower than the level of the surrounding plains, while, according to available estimates, the lower boundary of ice-containing rocks must be deeper by another kilometer. However, at the initial formation stage of the crater, its transient cavity probably reached a depth on the order of 20 km. Such a deep cavity must have significantly deepened into the aquifer where minerals containing chemically bound water could be formed in rocks that were in contact with water for a geologically long time. The material of this aquifer must account for a significant fraction of the ejections from the crater. According to Russell and Head, the cover of ejections from the Lyot crater was developed mainly north of the crater, where it stretches to approximately one crater diameter. The epithermal neutron flux typically varies between 0.13 and 0.18 counts/s in this Martian region and between 0.14 and 0.15 counts/s within the crater and its zone of ejections. The fast neutron flux here is 0.09–0.15 counts/s, typical of the region of seasonal moistening that overlaps with this region. In general, we failed to find any change in the neutron fluxes that are clearly confined to the Lyot Crater and its ejections.
The Stealth region lies south of Olympus Mons at latitudes from 4° N to 9° S, 210°Ð240° E (see the figure). In the west, it borders the region of low epithermal neutron fluxes southwest of Olympus Mons; in the east, it borders the region of high fluxes mentioned above (from 60° S to 60° N, 250°-330° E). The surface albedo here is relatively high (Moroz, 1979), while the thermal inertia of the upper 1 to 2-cm surface layer is low (Mellon et al., 2000). The geologic map for the western part of Mars (Scott and Tanaka, 1986) shows that very different geologic units were developed in the radiophysically single Stealth region: Amazonian and Hesperian lavas, the Amazonian Medusae Fossae formation (loose deposits easily blown by wind), Amazonian landslide deposits of the western flank of Arsia Mons, and Noachian deposits of ridge plains. As was noted above, judging by radar data, all of this is covered by a layer of fine-grain low-density material several meters in thickness. Within the Stealth region, whose contours enclose completely or partially more than 15 (4°x4°) pixels of the neutron maps being analyzed, the epithermal neutron fluxes vary between 0.14 and 0.21 counts/s; i.e., they are the same as those to the north and the south of this region. The fast neutron flux in the Stealth region varies between 0.10 and 0.20 counts/s; i.e., it is the same as that outside this region. In general, we see no change in the neutron fluxes that are clearly confined to the Stealth region.
The Observed Neutron Fluxes in Geologic Context. Thus, it follows from the aforesaid that in the ±60¡ latitude zone, decreases in the flux of epithermal neutrons formed in a 1 to 2-m-thick layer are observed near the boundaries of this zone, i.e., at high latitudes. The obvious cause of these decreases is the presence of ground water ice, as was pointed out by Boynton et al. (2002), Mitrofanov et al. (2002a), and Feldman et al. (2002). Further equatorward, the flux shows no correlation with either geographic latitude or surface elevation. Two geographically antipodal negative anomalies, which were first noted by Mitrofanov et al. (2002a, 2002c) and Feldman et al. (2002), are observed in the epithermal neutron flux distribution in the subequatorial part of Mars. Very loose deposits easily erodible by wind are located on the surface in these two regions, which in combination with their antipodal nature served as the basis for considering them to be the places where the geographic poles of the planet were in the geologic past (Schultz and Lutz, 1988).
With the exception of these two places, no correlation was found between the epithermal neutron flux and the geologic structure of the terrain in the zone under consideration. We did not find it by comparing the global neutron flux distribution with the units shown in global geologic maps. Nor was such a correlation found for several size-limited regions: Chryse Planitia, which was probably the bed of an ocean gulf (Baker et al., 1991) in the past, the hematite deposit in Sinus Meridiani, where the presence of hematite is associated with its deposition from water under sedimentary or hydrothermal conditions (Christensen et al., 2001b), the Lyot Crater, which probably penetrated the subpermafrost aquifer at the time of its formation, and the Stealth region, in which widely differing (in age and properties) geologic units lie beneath the loose low-density surface layer.
The lack of any correlation between the neutron flux and the mapped geologic units clearly stems from the fact that these units were identified and mapped by analyzing the surface morphology with sizes of the landforms considered in this analysis on the order of several kilometers or more. The identified units are fairly thick (tens and hundreds of meters or kilometers) geologic bodies (impact breccia, lavas, sediments), and the 1 to 2-m surface layer where the epithermal neutron flux originates is simply invisible during this morphological analysis. Clearly, this (and, in several cases, thicker) layer of loose material (regolith), which almost everywhere covers the basement deposits (Malin et al., 2001), is a cover of material that is generally not strongly bound in composition and origin with the geologic units under lying it. A geologic analysis of this cover requires studying high-resolution (meters) images (see, e.g., Malin et al., 2001) and involves specially treated data of high-accuracy laser altimetry (see, e.g., Kreslavsky and Head, 2001). The results of this analysis can be presented in the form of maps similar to Quaternary deposit maps known in geologic studies of the Earth.
The high (compared to many other Martian regions) epithermal neutron fluxes on Chryse Planitia raise the following question: Why is there no evidence of enhanced contents of bound water in this region, which may have been the floor of an ocean gulf or which is a region where the mouths of very large fluvial valleys open up? There can be several answers. The ocean may have existed for a short time. The fluid whose flow cut through valleys may have not been water. Maybe, the point is that, as was said above, the composition of the upper 1 to 2-m surface layer incompletely reflects or does not reflect at all the composition of its underlying deposits.
The absence of enhanced water contents associated with the hematite deposit is also difficult to understand. It follows from the paper by Christensen et al. (2001b) that the formation of gray hematite is most likely associated with its chemical deposition from iron-rich water solutions in sedimentary or hydrothermal processes. Under terrestrial conditions, these processes generally also give rise to minerals containing bound water, for example, clay minerals and related chlorites. In contrast to Chryse Planitia, we cannot explain the lack of evidence for appreciable amounts of bound water here by the presence of a covering "low-water" layer. The point is that this layer would cover not only the expected water-containing minerals but also the hematite itself. Maybe, hematite with a large specific weight in Sinus Meridiani form not primary but residual accumulations and the lighter water-containing silicates formed with it in the past were carried away by wind. It may also well be that when hematite was deposited here, no appreciable amount of water-containing minerals were formed.
The absence of enhanced water contents confined to the Lyot Crater and its ejecta may stem from the fact that the transient cavity of this 215-km crater did not reach the aquifer with the expected water-containing minerals because of its deeper deposition or even absence. However, again, the point most likely is that the material of the upper 1 to 2-m regolith inside the crater and on its ejecta is largely not local and its composition is not rigidly bound with the composition of the underlying deposits.
The fact that the Stealth region does not manifest itself in any way in the epithermal and fast neutron fluxes and, hence, in the surface water content seems important in light of the choice between the available predictions of the water ice content in the Martian soil at low and middle latitudes. As was noted above, it follows from the calculations by Farmer and Doms (1979) and Mellon and Jakosky (1993; 1995) that in the ±40° latitude zone at depths from the surface to 10 m, water ice is unstable during almost the entire Martian year. According to these calculations, there should be no ice in the soil of the Stealth region.
At the same time, it follows from the estimates by Paige (1992) that ice in the Martian soil can be stable almost everywhere. When the soils have low thermal inertia, other things being equal, the annual subsurface temperatures must be lower. Accordingly, in the Stealth region, where the upper several meters of soil are finegrain low-density and hence, low thermal inertia material, water ice must be stable (Paige, 1992). The relatively high surface albedo characteristic of this region must also contribute to this stability. However, the HEND measurements give no evidence for the presence of appreciable amounts of water ice here. It thus follows that the estimates by Farmer and Doms (1979) and Mellon and Jakosky (1993; 1995) better correspond to the Martian realities than do the estimates by Paige (1992).
We noted above that the variations in the flux of epithermal neutrons in the ±60° latitude zone occasionally correlate with the thermal inertia, which, for example, is easy to understand for the regions of Arabia Terra and southwest of Olympus Mons: the loose and, obviously, fine-grain surface material in these regions, naturally, also have low thermal inertia. In most cases, however, no correlation between the thermal inertia and the epithermal neutron flux is observed. The lack of correlation is not surprising either: the epithermal neutron flux originates in a 1 to 2-m-thick surface layer, while the observed thermal inertia characterizes only its upper 1–2 mm up to 1–2 cm.
As we showed above, the fast neutron flux originating in a 20 to 30-cm-thick layer is characterized by low values at high latitudes with their equatorward extension with a clear (although not always distinct) dependence on elevation. The low fast neutron fluxes observed here are obviously due to the presence of ground water ice (Boynton et al., 2002; Mitrofanov et al., 2002; Feldman et al., 2002). Further equatorward, the fast neutron flux variations over the area in the global mapping appear sporadic.
Estimates of the Possible Content of Bound Water and Their Planetological Significance
In prospect, after further studies, the measured neutron fluxes will make it possible to estimate the hydrogen (water) content in the Martian surface layer not in terms of "higher" or "lower" but quantitatively. This can be roughly done already now based on the measured water contents at the Viking-1, Viking-2, and Mars Pathfinder landing sites, the measured neutron fluxes at these and other sites of Mars, and the established dependences of neutron-flux variations on the ground water content. This, in particular, was done by Feldman et al. (2002). By assuming that the mass fraction of ground water at the Viking-1 landing site is ~1% and using the model calculations published by Boynton et al. (2002), these authors estimated the ground water contents in the Arabia region and southwest of Olympus Mons to be 3.8 ± 0.6% and 3.5 ± 0.5%, respectively.
We applied the same approach to the HEND measurements of the epithermal neutron flux, which is less affected by seasonal moistening than the fast neutron flux. Following Feldman et al. (2002), we assume that the ground water content at the Viking-1 landing site is ~1% and use the model calculations by Boynton et al. (2002) for the dependence of the relative neutron flux on the water content. The measured epithermal neutron flux at the Viking-1 landing site is 0.18–0.20 counts/s. As was discussed above, it is mainly determined by the presence of chemically bound water. At the Mars Pathfinder landing site, the epithermal neutron flux is the same as that at the Viking-1 landing site (0.18– 0.20 counts/s). Clearly, it is also determined mainly by the presence of chemically bound water. According to APXS data, the contents of bound water here are approximately the same as those at the Viking-1 landing site, which, to a certain degree, confirms the applicability of the approach used. The low epithermal neutron flux at the Viking-2 landing site (0.12–0.14 counts/s) is clearly associated with the influence of seasonal moistening. Therefore, it cannot be correlated with the content of bound water determined by the gas chromatograph–mass spectrometer of this spacecraft.
Thus, if the dependence of the neutron flux on the water content from Boynton et al. (2002) is applicable to the HEND data, then the water content in the region of high epithermal neutron fluxes (0.20–0.26 counts/s) ranges from < 0.5% to ~1%. Clearly, this is mainly chemically bound water. In the region of seasonal moistening (from 0.04 0.10 to 0.12 0.15 counts/s), the water contents probably are from ~5% to 10% closer to the poles and 3–4% closer to the equatorward boundaries of this region. Obviously, this is mainly ice. In regions with typical intermediate epithermal neutron fluxes (0.15–0.19 counts/s), i.e., outside regions of low and high fluxes, the water contents are probably close to 1–3%. This appears to be mainly chemically bound water.
For the regions of Arabia Terra and southwest of Olympus Mons, this estimate gives a water content on the order of 3–5% (equal to the estimates by Feldman et al., 2002). This appears to be also mainly chemically bound water. According to the estimates by Farmer and Doms (1979) and Mellon and Jakosky (1993; 1995), there should be no water ice during the HEND measurements (Ls from 329° to 27.5°). If the Medusae Fossae formation and similar deposits of Arabia Terra are actually an ancient analogue of layered polar deposits, then it would be natural to expect that they consist of the dust brought there by winds that may have a composition similar to terrestrial palagonite (Banin et al., 1992; Basilevsky et al., 1999). This material is known to contain much chemically bound water. For example, the well-known Martian soil palagonite simulant JSC Mars-1 (Allen et al., 1995) contains 5.4% of chemically bound water (Basilevsky et al., 2000).
If we assume that chemically bound water in the Martian surface material is contained in clays and related minerals characterized by water contents from 5% to 10%, then the content of clays in this material in regions of high epithermal neutron fluxes at its formation depth can be from 2 to 20%. In regions with typical intermediate epithermal neutron fluxes, the content of clays in this material can be from 10% to 30%. If all or almost all of the water at the formation depth of the epithermal neutron flux in the regions of Arabia Terra and southwest of Olympus Mons is in the form of clays, then the material here must contain from 30% to almost 100% of clay. These estimates pertain not to the uppermost layer, which is characterized by a uniform distribution of the fast neutron flux except for the region of seasonal moistening, but to depths from 20–30 cm to 1-2 m. This is consistent with the results obtained by the thermoemission spectrometer (TES), which sees no evidence for the presence of clays on the Martian surface at their detection threshold ~10% (Christensen et al., 2001a). If this is the case, then it should be assumed that a process destroying the water-containing minerals or, at least, making them spectrally unrecognizable acts on the current Martian surface.
Analysis of the geographic distribution of the epithermal and fast neutron fluxes from the Martian surface measured by the High-Energy Neutron Detector from mid- February through mid-June 2002 shows their clear correlation with latitudinal climatic zones attributable to the presence of water on the surface and in the soil at high latitudes. This result is consistent both with previous observations (Boynton et al., 2002; Mitrofanov et al., 2002a; Feldman et al., 2002) and with theoretical predictions (Farmer and Doms, 1979; Mellon and Jakosky, 1993).
There are regional neutron-flux variations further equatorward, outside the zones of climatic effects, which appear to be attributable to the presence of chemically bound water. With the exception of the epithermal neutron fluxes in the regions of Arabia Terra and southwest of Olympus Mons (Medusae Fossae), these variations show no correlation with the geologic structure of the terrain (at the level of global geologic maps). This probably implies that to the formation depth of epithermal (1–2 m) and fast (20–30 cm) neutrons, much of Mars is covered by a material that bears little relation in composition to local bedrocks. Clearly, this is an aeolian cover whose fine-grain component was mixed by dust storms in the geologic time on the scale of large regions.
The decrease in the flux of epithermal neutrons in the regions of Arabia Terra and southwest of Olympus Mons (Medusae Fossae) is evidently attributable to an enhanced concentration of materials containing chemically bound water (clay minerals, palagonite, hydrates, and hydrosalts) in the surface layers of these regions.
We thank H. Waenke, M.A. Kreslavsky, R.O. Kuzmin, B.A. Ivanov, R. Reader, and N. Foley for helpful discussions, K. Tanaka for the digital version of the geologic map, and B. Jakosky and M. Mellon for the digital version of the Martian thermal inertia map.
1. Allen, C.C., Morris, R.V., Jager, K.M., et al., Martian Regolith Simulant JSC Mars-1, LPSC XXIX, 1998, abstract no. 1690.
2. Arvidson, R.E., Gooding, J.L., and Moore, H.J., The Martian Surface as Imaged, Sampled, and Analyzed by the Viking Landers, Rev. Geophys., 1989, vol. 27, pp. 39–60.
3. Baker, V.R., Strom, R.G., Gulick, V.C., et al., Ancient Oceans, Ice Sheets and the Hydrological Cycle on Mars, Nature (London), 1991, vol. 352, pp. 589–594.
4. Banin, A., Clark, B.C., and Waenke, H., Surface Chemistry and Mineralogy, Mars, Kiefer, H.H., Ed., Univ. of Arizona Press, 1992, pp. 594–625.
5. Basilevsky, A.T., Yakovlev, O.I., Fisenko, A.V., et al., Simulation of impact melting effect on spectral properties of the Martian Surface, Geochem. Int., 2000, vol. 38, suppl. 3, pp. S390–S403.
6. Basilevsky, A.T., Markiewicz, W.J., Thomas, N., and Keller H.U., Surface Material and Landscape Characteristics at the Mars Polar Lander Landing Site: A Consideration and Prediction, Astron. Vestn., 1999, vol. 33, no. 6, pp. 499–513 [Sol. Syst. Res. (Engl. transl.), 1999, vol. 33, no. 6, p. 439].
7. Biemann, K. and Oro., J., Toulmin III, P. et al., The Search for Organic Substances and Inorgainic Volatile Compounds in the Surface of Mars, J. Geophys. Res., 1977, vol. 82, pp. 4641–4658.
8. Biemann, K., The Implications and Limitations of the Findings of the Viking Organic Analysis Experiment, J. Mol. Evol., 1979, vol. 14, pp. 65–70.
9. Boynton, W.V., Feldman, W.C., Squyres, S.W., et al., Distribution of Hydrogen in the Near Surface of Mars: Evidence for Subsurface Ice Deposits, Science, 2002, vol. 297, pp. 81–85.
10. Bridges, J.C., Catling, D.C., Saxton, J.M., et al., Alteration Assemblages in Martian Meteorites: Implications for Near-Surface Processes, Space Sci. Rev., 2001, vol. 96, pp. 365–392.
11. Christensen, P.R., Bandfield, J.L., Hamilton, V.C., et al., M., Mars Global Surveyor Thermal Emission Spectrometer Experiment: Investigation Description and Surface Science Results, J. Geophys. Res., 2001, vol. 106, pp. 23K823–23K871.
12. Christensen, P.R., Morris, R.V., Lane, M.D., et al., Global Mapping of Martian Hematite Mineral Deposits: Remnants of Water Driven Processes on Early Mars, J. Geophys. Res., 2001, vol. 106, pp. 23K873–23K885.
13. Clifford, S.M., A Model for the Hydrologic and Climatic Behavior of Water on Mars, J. Geophys. Res., 1993, vol. 98, pp. 10K973–11K016.
14. Edgett, K.S., Buttler, B.J., Zimbelman, J.R., and Hamilton, V.E., Geologic Context of the Mars Radar "Stealth" Region in Southwestern Tharsis, J. Geophys. Res., 1997, vol. 102, pp. 21K545–21K567.
15. Farmer, C.B. and Doms, P.E., Global and Seasonal Water Vapor on Mars and Implications for Permafrost, J. Geophys. Res., 1979, vol. 84, pp. 2881–2888.
16. Feldman, W.C., Boynton, W.V., Tokar, R.L., et al., Global Distribution of Neutrons From Mars: Results From Mars Odyssey, Science, 2002, vol. 297, pp. 75–78.
17. Foley, C.N., Economou, T.E., and Clayton, R.N., Chemistry of Mars Pathfinder Samples Determined by APXS, LPSC XXXI, 2001, abstract no. 1979.
18. Foley, C.N., Mars Pathfinder Analyses and Interpretations, PhD dissertation, The Univ. of Chicago, (Chicago, 2002).
19. Greeley, R. and Guest, J.E., Geologic Map of the Eastern Equatorial Region of Mars. Atlas of Mars, map I-1802-B, 1987.
20. Hartmann, W.K. and Neukum, G., Crater Chronology and the Evolution of Mars, in Chronology and Evolution of Mars, Kallenbach, R., et al., Eds., Dordrecht: Kluwer, 2000, pp. 165–194.
21. Jakosky, B.M. and Haberle, R.M., The Seasonal Behavior of Water on Mars, in Mars, Kieffer, H.H. et al., Eds., Univ. of Arizona Press, 1992, pp. 969–1016.
22. Kreslavsky, M.A. and Head, J.W., Kilometer-Scale Roughness of Mars: Results From MOLA Data Analysis, J. Geophys. Res., 2002, vol. 105, pp. 26K695–26K711.
23. Litvak, M.L., Mitrofanov, I.G., Kozyrev, A.S., et al., Seasonal Variations of Subsurface Hydrogen as Seen by High Energy Neutron Detector, Mars Odyssey, Vernadsky-Brown Microsymposium no. 36, abstract no. 063, CD-ROM, Moscow, 2002.
24. Litvak, M.L., Mitrofanov, I.G., Kozyrev, A.S., et al., Seasonal Neutron-Flux Variations in the Polar Caps of Mars as Revealed by the Russian HEND Instrument Onboard the NASA 2001 Mars Odyssey Spacecraft, Astron. Vestn., 2003, vol. 37, no. 5, pp. 378–386.
25. Litvak, M.L., Basilevsky, A.T., Mitrofanov, I.G., et al., Distribution of Chemically Bound Water in Surface Layer of Mars Based on data acquired by High Energy Neutron Spectrometer, Mars Odyssey, Vernadsky-Brown Microsymposium 36, abstract no. 062, CD-ROM, Moscow, 2002.
26. Malin, M.C. and Edgett, K.S., Mars Global Surveyor Mars Orbiter Camera: Interplanetary Cruise Through Planetary Mission, J. Geophys. Res., 2001, vol. 106, pp. 23K429–23K570.
27. Mellon, M.T. and Jakosky, B.M., Geographic Variations in the Thermal and Diffusive Stability of Ground Ice on Mars, J. Geophys. Res., 1993, vol. 98, pp. 3345–3364.
28. Mellon, M.T. and Jakosky, B.M., The Distribution and Behavior of Martian Ground Ice during Past and Present Epochs, J. Geophys. Res., 1995, vol. 100, pp. 11781–11800.
29. Mellon, M.T., Jakosky, B., Kieffer, H., and Christensen, P., High Resolution Thermal Inertia Mapping From the Mars Global Surveyor Thermal Emission Spectrometer, Icarus, 2000, vol. 148, pp. 437–455.
30. Mitrofanov, I., Anfimov, D., Kozyrev, A., et al., Maps of Subsurface Hydrogen From High Energy Neutron Detector, Science, 2002, vol. 297, pp. 78–81.
31. Mitrofanov, I.G., Litvak, M.L., Kozyrev, A.S., et al., First results of Mars Mapping of Neutron Flux by High Energy Neutron Detector, Mars Odyssey, Vernadsky-Brown Microsymposium 36, abstract no. 069, CD-ROM,Moscow, 2002.
32. Mitrofanov, I.G., Litvak, M.L., Kozyrev, A.S., et al., Search for Water in Martian Soil Using Global Neutron Mapping by the Russian HEND Instrument Onboard the US 2001 Mars Odyssey Spacecraft, Astron. Vestn., 2003, vol. 37, no. 5, pp. 366–377.
33. Moroz, V.I., Fizika planety Mars, (Physics of the Planet Mars), Moscow: Nauka, 1978.
34. Muhleman, D.O., Butler, B.J., Grossman, A.W., and Slade, M.A., Radar Images of Mars, Science, 1991, vol. 253, pp. 1508–1513.
35. Paige, D.A., The Thermal Stability of Near Surface Ground Ice on Mars, Nature (London), 1992, vol. 356, pp. 43–45.
36. Russell, P. and Head, J.W., The Martian Hydrosphere/Cryosphere System: Implications of the Absence of Hydrologic Activity at Lyot Crater, Geophys. Res. Lett., 2002, vol. 29, Doi: 10.1029/2002GL015178.
37. Schultz, P.H. and Lutz, A.B., Polar Wandering on Mars, Icarus, 1988, vol. 73, pp. 91–141.
38. Scott, D.H. and Carr, M.H., Geologic Map of Mars. Atlas of Mars, map I-1083, 1978.
39. Scott, D.H. and Tanaka, K.L., Geologic Map of the Western Equatorial Region of Mars. Atlas of Mars, map I-1802-A, 1986.
40. Tanaka, K.L. and Scott, D.H., Geologic Map of the Polar Regions of Mars. Atlas of Mars, map I-1802-C, 1987.
41. Zent, A.P. and Quinn, R.C., Simultaneous Adsorption of CO2 And H2O Under Mars-Like Conditions and Application to the Evolution of the Martian Climate, J. Geophys. Res., 1995, vol. 100, pp. 5341–5349.
