")
")
Soil Water Content on Mars as Estimated from Neutron Measurements by the HEND Instrument Onboard the 2001 Mars Odyssey Spacecraft
I.G.Mitrofanov1, M.L.Litvak1, A.S.Kozyrev1, A.B.Sanin1, V.I.Tret'yakov1, V.Yu.Grin'kov1, W.V.Boynton2, C.Shinohara2, D.Hamara2, and R.S.Saunders3
1 Space Research Institute, Russian Academy of Sciences, Profsoyuznaya ul. 84/32, GSP-7, Moscow, 117810 Russia
2 Lunar and Planetary Laboratory, University of Arizona, Tucson, AZ 85721, USA
3 NASA Headquarters, Washington, DC 20514, USA
Abstract - We present the results of 20 months of observations of Mars by the Russian HEND instrument onboard the NASA 2001 Mars Odyssey spacecraft. We show that there are two extended subpolar regions with a soil water content of several tens of percent in the northern and southern hemispheres of Mars. The southern subpolar region is well described by a two-layer model, according to which a soil with a water content of up to 55% by mass lies under a relatively dry soil with a water mass fraction of 2% and a thickness of 15–20 g/cm2. The distribution of water in Martian regolith northern subpolar region is in good agreement with the homogeneous model and does not require invoking the more complex two-layer soil model. The water-ice content in the subsurface layer of the northern subpolar region reaches 53 % by mass. We show that there are two regions with a relatively high water content near the Martian equator. These are Arabia Terra and the Medusae Fossae formation region southwest of Olympus Mons. In these regions, a lower layer with 9–10% of water by mass may underlie the upper layer of relatively dry material ~30 g/cm2 in thickness. The "moistest" spot near the equator is at about 30°E and 10°N. Its lower-layer soil may contain more than 16% of water by mass.
DOI: 10.1023/B:SOLS.0000037461.70809.45 - http://www.springerlink.com/content/l03r70850v41k841/
-------------------------------------------------------------------------------------------------------------------------------------------------
ESTIMATION OF THE SOIL WATER CONTENT FROM NEUTRON MEASUREMENTS:
FORMULATION OF THE PROBLEM
THE SOLIS PLANUM REGION AS A REFERENCE AREA FOR THE NEUTRON MAPPING OF MARS
ESTIMATION OF WATER CONTENT IN REGIONS WITH LOW NEUTRON FLUX
IN THE VICINITY OF THE MARTIAN POLES
ESTIMATION OF WATER CONTENT IN THE MID-LATIDUDE REGIONS WITH
LOW NEUTRON FLUXES
It had been known before the observations from the NASA 2001 Mars Odyssey spacecraft started that the maximum amount of water in the atmosphere of Mars is no more than 100 μm (Jakovsky and Farmer, 1982), and that the permanent north polar cap consists of pure ice (Kieffer et al., 1976). The permanent south polar cap is covered with a layer of frozen carbon dioxide all the year round (Kieffer et al., 1979; Paige et al., 1990). However, the principal question of whether the polar caps are the main water reservoir on the present-day Martian subsurface that preserves water in the form of ice and slightly enriches the Martian atmosphere with water vapor in summer or there are also other water reservoirs on the surface of Mars has remained unsolved. In fact, the answer to this question determines the scenario of the hydrological evolution and the current status of Mars, i.e., whether the present Mars is a "cold and dry" desert or active hydrological processes take place immediately below its surface.
Studies of Mars from an orbit revealed land forms that could be produced by flows running down the slopes or through the accumulation of mineral deposits within water-filled reservoirs (see, e.g., Malin and Edgett, 2000). Some of these structures are relatively young, and they could not be formed at the epoch of the early Mars with a "moist and warm" surface. Most of the researchers are inclined to believe that gullies on the Martian slopes were formed during short-time outflows of soil water on the surface, but there were no direct evidence for the presence of water reservoirs under the surface. For example, one cannot rule out the possibility that the erosion forms on the surface of Mars were produced by flows of liquid carbon dioxide.
The views of the hydrological nature of the present Mars have changed significantly owing to the measurements of the neutron and gamma-ray fluxes from the planetary surface that are currently being performed from the NASA 2001 Mars Odyssey spacecraft by the American gamma-ray spectrometer based on highpurity germanium, the Russian High-Energy Neutron Detector (HEND), and the American neutron spectrometer. These instruments were combined into a complex GRS experiment aimed at studying the nuclear radiation of Mars (Boynton et al., 2002; Mitrofanov et al., 2003).
Even the first results obtained over three months of mapping Mars showed that there is a very high content of hydrogen in large areas of the Martian surface. Hydrogen was detected in soil at a depth of 1–2 m by the high degree of neutron moderation and the high flux of photons in the 2.2 MeV nuclear line that are produced when thermal neutrons are captured by hydrogen nuclei. These results were presented in a series of papers (Boynton et al., 2002; Mitrofanov et al., 2002; Feldman et al., 2002) and in the paper by Mitrofanov et al. (2003).
Now that a large number of measurements aimed at the global mapping of the neutron radiation from Mars have been performed, it is time to analyze in more detail the observational data to obtain the most reliable estimates of the water content in various regions of the planetary surface. Our paper is devoted to this issue.
ESTIMATION OF THE SOIL WATER CONTENT
FROM NEUTRON MEASUREMENTS:
FORMULATION OF THE PROBLEM
Mitrofanov et al. (2003) thoroughly described how the neutron radiation of Mars arises under bombardment of the material of the planet's 1–2 m subsurface layer by a flux of charged cosmic-ray particles. The produced primary neutrons have initial energies of several tens of megaelectronvolt. These particles collide with nuclei of the material and gradually lose their energy. The energy of the neutrons escaping from the planetary surface depends on the number of collisions they have experienced. There is some characteristic number of collisions Nth after which neutrons are completely "thermalized", that is, lose their initial energy and become thermal. After leaving the surface, these neutrons form a thermal component of the neutron radiation of Mars. The particles that leave the Martian surface after they experienced less collisions (< Nth) have no time to get thermalized. Their energies are distributed somewhere between initial values of about several tens of megaelectronvolt and the energies of thermal motion. These particles with suprathermal energies can be associated with epithermal neutrons (1 eV–0.1 MeV), fast neutrons (0.1 MeV–1.0 MeV), or high-energy neutrons (>1.0 MeV).
Even a small amount of hydrogen nuclei in the soil results in a considerable increase in the moderation efficiency. Hence, a number of collisions necessary for the neutron thermalization in the presence of hydrogen Nth(H)<< Nth becomes noticeably smaller. At small hydrogen contents, the neutrons leaving the surface after N< Nth collisions have epithermal energies, while the number of collisions N>Nth(H) in the presence of hydrogen is enough for thermalization, and these neutrons compose a thermal component of the neutron flux. Because of this fact, the epithermal neutron component decreases in the outgoing flux, while the thermal component increases. Water is the main hydrogencontaining substance in the Martian soil; thus, the soil water content in different regions of Mars can be estimated based on the investigation of the regional variability of the neutron flux from the Martian surface, and the global map of water (or water ice) abundance under the planetary surface can be constructed.
It should be taken into account that the nuclear methods of mapping the planetary surface from the orbit are principally different from the construction of its images using optical and infrared instruments or radars, when the "picture" of the surface in view arises immediately during the signal recording. In this case, each pixel corresponds to an individual recorded signal, and an improvement of the spatial resolution is associated with an increase in the number of signals measured independently. The application of special methods can improve the contrast or spatial resolution of the classic image without changing its basic structure.
Constructing the picture of the planetary surface with the help of nuclear spectroscopy methods, we should keep in mind that the neutron and gamma radiation of Mars arise in subsurface soil layers with a thickness of 1–2 m. It is also not know at which direction the recorded photons and neutrons arrive. The detector of nuclear radiation at the orbit is an "analog integrator" of different signals, coming from different depths of the subsurface layer and along different directions under the space vehicle. Generally, the field of view of the neutron detector at the Martian orbit extends so far as to the horizon of the planet; however, because of the atmospheric absorption, the possibility of photon and neutron recording becomes smaller when the direction of their propagation is different from that to the zenith. The dimension of the physically homogeneous "volume elements" of the radiating substance can be considerably smaller than the entire observed volume, over which the signal is "integrated". Thus, the problem of the spatial resolution of the heterogeneous brightness of a source in horizontal and vertical is essentially reduced to the solution of the integral equation with an unknown function under the integral. It is known that such problems of mathematical physics are "incorrect" and some additional assumptions are needed for their solution.
Thus, to construct "the map of water abundance" in the subsurface layer from the orbital neutron measurements, we should develop a model-dependent procedure restoring the water abundance at different points of the volume in view on the basis of recorded neutrons of different energies at different orbital points and the knowledge of the device efficiency function. Several models should be incorporated in this procedure:
(I) Device model. This model should ensure the conversion of the neutron flux spectral density at the orbit in the vicinity of the space craft to the expected neutron count rate in the detectors of the HEND device.
(II) Atmospheric model. This model must describe the transformation of the spectral density of the neutron flux from different surface elements to the spectral density of the flux at a given orbital point taking into account the atmospheric absorption and scattering of neutrons.
(III) Model of the Martian subsurface. The soil structure model should relate the flux of neutron radiation from the layer of "nuclear emission" deep under the surface to model parameters describing the soil composition and structure.
(IV) Model of cosmic rays. This model should determine the flux of energetic charged particles, which produce primary neutrons in the soil material described by the chosen model (III).
The aforementioned models (I)–(IV) allow us to perform the numerical calculation of the expected neutron count rate in the detectors of the HEND device for each complete set of model parameters. Comparing the measured count rate in the detectors to the expected one, we can either accept (in the case of statistical agreement) or reject (in the case of statistical disagreement) the tested model versions. Obviously, in a general case, each of models (I)–(IV) can be verified against the neutron observation data. However, models (I), (II), and (IV) should be fixed in the problem of estimating the soil water content, which must be described by free parameters of model (III). Therefore, the conclusion of the agreement between the model predictions and the observations essentially means that the reliable estimates of the parameters of model (III) of water distribution in the soil were obtained.
Thus, the restored structure of water abundance in subsurface is (and must be) model-dependent. In the broad sense, this means that the result depends on all models (I)–(IV). In the narrow sense, this statement reflects the dependence of the result on the suggested soil structure, adopted in model (III). Two different models (III) can be in quite good agreement with the observation data, but, at the same time, correspond to different estimates of water content, different water depths, different layer structures, etc.
The construction of the map of water abundance for different pixels is reduced to the comparison of the expected neutron count rate, calculated according to models (I)–(IV), and observations for each elementary surface patch. This comparison should be based on a "goodness-of-fit criterion". We used the well-known Pearson criterion for this purpose
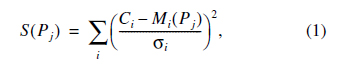
where Ci are the integral neutron counts measured by different detectors i = 1, 2, … of HEND for the given surface region, Mi is the model-predicted counts in these detectors, σi is the measurement error, and Pj is the set of model parameters used in calculations.
Some parameters are fixed or vary according to some given law. When we are estimating the soil water content, the parameters of model (III) are assumed to be free. Then, the procedure of measuring the water content for the given pixel is reduced to the search of such best values of the parameters, at which functional (1) is minimized, that is, the differences between the measured counts Ci and the model-predicted counts Mi reach their minimum.
Varying free parameters within their region of definition, we can try for the minimum of the functional Smin(Pi(*)). If we reach this minimum, this means that the given model with the parameters Pi(*) describes the observation data for the given pixel in the best way. However, if the minimum of functional (1) has been reached, it does not always mean that we have obtained satisfactory agreement between the model and the observations. "The goodness-of-fit test" for functional (1) can be thought to be satisfied at the level of accepting the hypothesis corresponding to the probability P only if the value of the minimum Smin(Pi(*)) with probability P agrees with the χn2 distribution of a random variable with n degrees of freedom, where n=k–p. The number k is equal to the number of signals measured independently, and p is the number of varied model parameters. The goodness-of-fit criterion usually corresponds to the probability of the hypothesis acceptance P above 0.01–0.10 (as a fraction of 1).
Thus, the problem of mapping the soil water content on Mars from neutron measurements can be reduced to the minimization of functional (1) for each pixel. The minimization of the difference between the measurement data and the model-predicted counts is performed using the fixed parameters of models (I), (II), and (IV) and varying the parameters of some given soil model (III).
Generally speaking, the verified soil model (III) can also be "exported" to this procedure, proceeding from other measurements or based on theoretical conceptions. If such an "external" model is absent, the principles of simplicity are preferred. In this case, the verified models should be ordered from the simplest to more complicated ones.
Model (III) with a prescribed homogeneous soil composition and a water content as the only variable parameter will be used as the simplest initial model below. More complicated models will be based on the assumption of the two-layer soil structure. They will be tested in the case when the simplest homogeneous model is rejected by observation data. The soil composition will be assumed to be the same in both models, and the layers will differ only in water (or water-ice) content. In this sense, the homogeneous model can be named "one-layer" in contrast to the more complicated "two-layer" model, in which the water content can be different in the upper and lower layers and the thickness of the upper layer is also a free parameter of the model.
Numerical computations in this work were held using the standard MCNPX package (see, e.g., Boynton et al., 2002), which allows the numerical simulation of the HEND detector counts (model I) knowing the cosmic-ray flux (IV), the structure of the soil with a variable composition (III), and parameters of the atmosphere between the surface and the point at the orbit (II). The computed values are compared to the results of k independent measurements obtained for the given surface element by three 3He detectors with different thicknesses of the surrounding moderator and in the Sc/IN scintillator in one or several spectral channels with energies from 0.8 to 15 MeV. Thus, the total number of summands in formula (1) is k in our case, and the number of degrees of freedom n is determined by the number of parameters p in the applied soil model. For example, water content is the free parameter of the homogeneous model, and the number of degrees of freedom is k–1. Two free parameters are usually used for the twolayer model. They are the thickness of the upper dry layer with a fixed composition and the water content in the lower layer. In this case, the number of degrees of freedom for the Pearson criterion is equal to k–2.
Both the methods used to solve the problem of estimating water content in the Martian soil and the results obtained by these methods are given below. The reliability of the model-dependent estimates of water content obviously depends on the correctness of the deconvolution procedure as strongly as on the quality measurements. That is why we are quite thorough in describing the deconvolution procedure in this paper.
THE SOLIS PLANUM REGION AS A REFERENCE AREA FOR THE NEUTRON MAPPING OF MARS
The map of epithermal neutron flux at the Mars Odyssey orbit is given in Fig. 1. It corresponds to the surface free of seasonal carbon dioxide depositions. The exposure of the map is 12 months for the 50°N–50°S annuli, 7 months for the northern high-latitude region >50°N, and 3.5 months for the southern highlatitude region >50°S. In this paper we deliberately omit the question of seasonal neutron-flux variations associated with winter carbon dioxide condensation on the Martian surface. Litvak et al. (2003) analyzed this problem in detail.
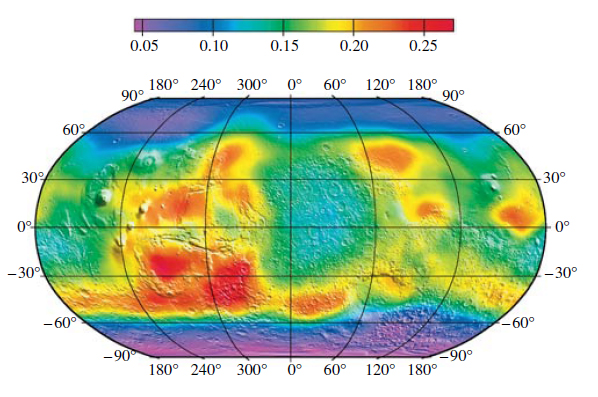
Fig. 1. The map of the epithermal neutron flux at the orbit of the Mars Odyssey spacecraft obtained from measurements of the HEND instrument (counts per second in the MD detector) for seasons with Ls = 100°–180° for latitudes >50°N, Ls = 0°–180° for latitudes from 50°S to 50°N, and Ls = 330° –20° for latitudes >50°S.
The brightest area of emission of epithermal neutrons lies in the Solis Planum region at 246°–293°E and 16°–53°S. According to the data of Viking 1, Viking 2, and Mars Pathfinder, the mass fraction of chemically bound water in the Martian soil is 1–3% (see, e.g., Basilevsky et al., 2003; Economou et al., 2003). As no noticeable variations of nuclear gammaline intensities are observed in Solis Planum (Boynton et al., 2003a) as compared to the data obtained for the landing sites of the aforementioned landers, it is possible that the composition of main rock-forming elements in Solis Planum is approximately the same as it is at the landing sites. We can suppose that the average water mass fraction in the soil of Solis Planum is about 2% and the soil composition corresponds to the Mars Pathfinder measurements (Rieder et al., 1997) and to the relative ratio of rock to soil contents equal to 50 to 50% by mass. Other regions of Mars with smaller fluxes of neutron emission must have higher water contents, respectively. Solis Planum can be adopted as a "reference area" for the neutron mapping of Mars.
The soil composition chosen for the Solis Planum region corresponds to the data of independent GRS and NS measurements. The orbital neutron fluxes in the NS experiment were calculated involving the normalization by the thick layer of frozen carbon dioxide existing on the northern pole of Mars during polar winter. The thickness of the carbon dioxide depositions was supposed to be so large that all neutrons were produced within this layer. Knowing the chemical composition of the layer (100% CO2), one can calculate the neutron flux at the Martian orbit and, thus, obtain absolute fluxes (Feldman et al., 2003). While analyzing the measured gamma radiation from the surface of Mars (the GRS experiment), the normalization by 100% of water was used in the permanent north polar cap during polar summer (Boynton et al., 2003b). Applying such absolute normalizations in both cases, we demonstrated that the soil in the Solis Planum region contains about 2% of water by mass (Boynton et al., 2003b; Feldman et al., 2003).
Assuming the composition of the Solis Planum soil known and having no seasonal variations, we can associate the observed measurements of the neutron flux from this region with the variability of the flux of energetic cosmic-ray particles on the Martian surface (model (IV)). To estimate this variability, we calculated the model count rate for neutrons from Solis Planum for different seasons of the Martian year varying the atmospheric thickness over Solis Planum according to the atmospheric model, developed at the NASA AMES Research center (Haberle et al., 1993; see model (II) above). We adopted the homogeneous soil model (III) and vary the cosmic-ray flux at the top of the planetary atmosphere as a free parameter of model (IV). The values of this parameter were estimated for different seasons from minimization of functional (1).
Analyzing the neutron flux variations from Solis Planum, we saw that the flux of galactic cosmic rays did not have any noticeable variation during the whole observation period (Fig. 2). Small flux variations within 10%, which we found, can be associated with both the influence of the descending phase of the solar cycle on the flux of galactic cosmic rays and the contribution of individual solar proton events, which was not completely eliminated in the neutron mapping database. The profile of cosmic-ray variations (Fig. 2) was used for processing the measurement data for other regions of Mars.
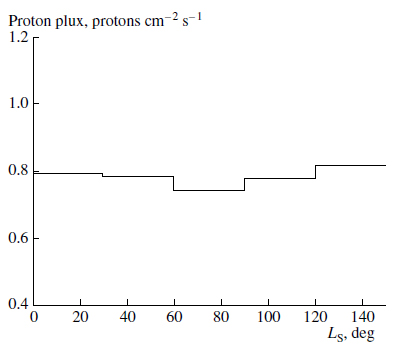
Fig. 2. The cosmic-ray flux for different seasonal intervals from April 2002 to March 2003 estimated from the measurements data over Solis Planum.
ESTIMATION OF WATER CONTENT IN REGIONS WITH LOW NEUTRON FLUX IN THE VICINITY OF THE MARTIAN POLES
Two vast subpolar regions with low fluxes can be revealed in the map of epithermal neutron fluxes from the Martian frost-free surface (Fig. 1). Their boundaries are approximately at latitudes 50°–60°.
The decrease in the neutron flux over these regions is connected with a high number of hydrogen atoms available in the soil. This hydrogen is a component of molecules of water, which can be present in high-latitude soil as a free ice. That is why the near-polar regions of Mars with the low neutron flux can be considered as regions with high water-ice content in subsurface ("ice permafrost" regions).
Solis Planum proved to be the brightest area of epithermal neutron emission. There are also two regions of the minimal epithermal neutron flux with coordinates (24°–28°E, 86°–90°N) and (220°–224°E, 78°–82°S) near the northern and southern poles, respectively (see Fig. 1). One should keep in mind that the measurements presented here correspond to the neutron fluxes at the orbit and do not allow for the neutron absorption in the Martian atmosphere. However, the atmospheric effects are quite weak and can be neglected in estimating the dynamic range of regional neutron-flux variations. The northern absolute minimum is located in the area of the residual north polar water-ice cap. Its position corresponds to ice Chasma Boreale. The southern minimum is lower in latitude than the permanent polar cap. This confirms the assumption that the south cap is mainly of frozen carbon dioxide.
If we compare the mapping data, we can see that a factor of regional variability (FRV) for epithermal neutrons is 9.4 and 8.8 for the northern and southern regions of their absolute minimum, respectively. This factor is significantly greater than the variability of the lunar neutron albedo (~1.4, see Feldman et al., 1998). This is caused by the fact that the neutron regional variability is associated with differences in the nuclear composition of main rock-forming minerals on the Moon and arises due to variations of soil water content over Mars. It means that mapping the neutron flux from Mars is a method allowing one to study the water abundance in the subsurface planetary layer 1–2 m thick.
The high-latitude belts of Mars are described in Table 1, which shows how the average water-ice content depends on latitude in near-polar regions. The regions as well as the seasonal intervals, during which the corresponding observation data were accumulated, are given in the first column of the table.
Proceeding from the principle of simplicity, it is worth to estimate the soil water content using the homogeneous soil model at the first stage of the neutron data processing. According to this model, a unit mass of the subsurface material contains ζhom parts of water and (1 –ζhom) parts of the material composed of 50% of rocks and 50% of soil and with the element composition identical to that measured by Mars Pathfinder (Rieder et al., 1997). The counts in four detectors of the HEND instrument were used as the observation data to verify the homogeneous model. They are three signals from epithermal and fast neutrons in the 3He counters and one signal from high-energy neutrons in the integral energy channel of the stilbene scintilscintillator. Thus, we had to compare the results of minimizing the functional S(ζhom) with the χ32 distribution with three degrees of freedom in order to test the homogeneous model.
For validation of the algorithm suggested for the estimation of water content based on the minimization of functional (1), we tested the model of homogeneous soil composition and variable water content for two regions with relatively high neutron fluxes (the northern part of Hellas Planitia and Argyre Planitia, Fig. 1). The homogeneous model turned out to be in good agreement with the measurement results in both cases; and, thus, the estimations of water content obtained for these regions can be taken as reliable. The neutron flux from these regions slightly differs from its maximal value from Solis Planum; and the estimated water content corresponds to 1.6% by mass for Argyre Planitia and 2.2% by mass for the northern part of Hellas Planitia. It should be explained that the low value 1.6% obtained for Argyre Planitia does not contradict our initial statement that the brightest for the epithermal neutron flux area of Solis Planum contains, on average, 2% of water. First, Argyre Planitia is much lower (topographically) as compared to Solis Planum, and, thus, the neutron flux from Argyre Planitia coming to the orbit is stronger attenuated in comparison with neutrons escaping from Solis Planum. Second, the two regions compared can have a different composition of the main soil, which can result in a slight difference in the neutron fluxes observed. In total, we can state that the algorithm verification was successful for regions with relatively high fluxes of epithermal neutrons, and now we can use this algorithm to estimate water content in regions with low neutron fluxes.
By minimizing the functional S(ζhom) as a partial case of expression (1), we estimated the water content parameter ζhom(*) for vast subpolar regions of Mars. It should be kept in mind that these values can be adopted as a reliable estimate of water content only if the minimum value of the functional Smin(ζhom(*)) meets the Pearson criterion. The probabilities of adopting the homogeneous model for the selected regions of Mars are also given in Table 1.
Table 1. Estimates of the water-ice content in the subpolar regions of Mars
| Region and Ls corresponding to its observation time | Region coordinates | Water content (in % by mass) estimated using homogeneous model | Probability of adopting homogeneous model | Water content (in % by mass) and water depth (g/cm2) estimated using two-layer model | Probability of adopting two-layer model |
| Northern polar region Ls = (120°–150°) | 0°–360° >80°N |
44.1 | 0.6 | - | - |
| Northern high-latitude belt Ls = (120°–150°) | 0°–360° 70°–80°N |
24.8 | 0.4 | - | - |
| Northern boundary belt Ls = (120°–150°) | 0°–360° 60°–70°N |
12.5 | 0.7 | - | - |
| Northern region of absolute minimum Ls = (120°–150°) | 24°–28°E 86°–90°N |
53 | 0.8 | - | - |
| Southern polar region Ls = (330°–360°) | 0°–360° >80°S |
22.7 | 0.004 | 55.0 16 |
0.26 |
| Southern high-latitude belt Ls = (330°–360°) | 0°–360° 70°–80°S |
19.5 | 0.03 | 54.0 19.2 |
0.41 |
| Southern boundary belt Ls = (330°–360°) | 0°–360° 60°–70°S |
11.2 | 0.07 | 25.3 22.4 |
0.72 |
| Southern region of absolute minimum Ls = (330°–360°) | 220°–224°E 78°–82°S |
25 | 0.016 | 55.0 16.0 |
0.08 |
The probability of adopting the homogeneous model is different for northern and southern subpolar regions. In the north, the homogeneous model fits the measurements quite well, and the probabilities of accepting the model are sufficiently high (see Table 1). The estimated average water content in the soil of the northern polar region (>80°N), northern high-latitude belt (70°–80°N), and northern boundary belt (60°–70°N) is about 44, 25, and 13% by mass, respectively. In the region of the northern absolute minimum, the water content estimated from the homogeneous model is 53% by mass.
To construct the map of water ice distribution, we partitioned the northern near-polar region into 74 partly overlapping regions, whose sizes approximately correspond to the spatial resolution of the orbital measurements (Table 2).
Table 2. Breakdown of the northern and southern ice permafrost regions into separate regions
| Location of elementary regions | Region size in latitude, deg | Number of regions |
| 60°–70°N/S | 15 | 24 |
| 65°–75°N/S | 18 | 20 |
| 70°–80°N/S | 24 | 15 |
| 75°–85° N/S | 36 | 10 |
| 80°–90° N/S | 72 | 5 |
The water content parameter was independently estimated for each of these regions under the homogeneous model approximation. The value of this parameter corresponding to the minimum of functional (1) was used as the estimate of the water-ice content for each region. It happened that the distribution of the minimal values of the minimized functional (1) corresponds the χ32 distribution (Fig. 3). This confirms that the homogeneous model can be applied for the entire set of the 74 tested regions of the northern "ice permafrost" region.
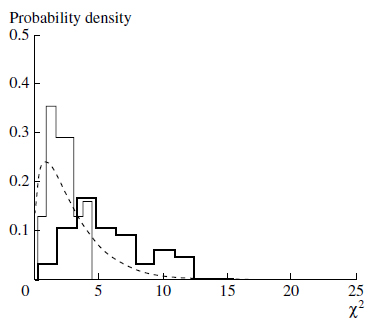
Fig. 3. The statistical distribution of minimums of functional (1) when testing the homogeneous model for 74 regions of the northern (thin line) and southern (thick line) "ice permafrost" region, respectively. The χ32 random distribution is shown by the dashed line.
The map of water-ice content for the northern nearpolar "ice permafrost" region, obtained by smoothing the estimates for the 74 regions with a high-resolution spatial filter, is presented in Fig. 4. The maximal water content of more than 50% by mass is observed in the 270° – 90°E sector of the residual polar cap. The greatest water content is found in the region of the northern absolute minimum (>50% by mass), which is located just inside Chasma Borealis.
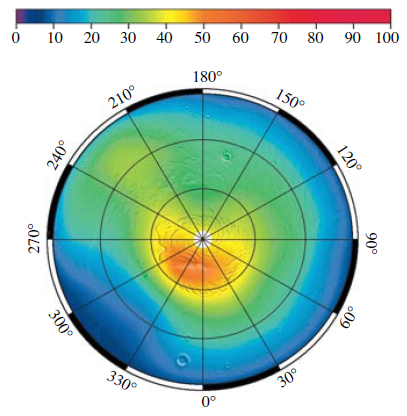
Fig. 4. The distribution of the water-ice content (% by mass) over the northern "ice permafrost" region (according to the homogeneous model). The estimates, obtained for the 74 surface regions (Table 2), are smoothed by the high-resolution spatial filter.
The 20% (by mass) level of the ice water content lies approximately along the 65°N latitude belt in the eastern hemisphere from 0° to 180° E. In the western hemisphere, this level is as low as at 60° N along the longitudinal sector 210°–240° E and as high as at 75° N along the longitudinal sector 310°–330° E.
The homogeneous soil model proved to be incorrect for the southern near-polar region. The model verification for the near-polar latitude belts (Table 1) showed that the probability of its agreement with observations is small and equals to 0.4%–7%.
It can happen that not the invalidity of the homogeneous soil model but a large spread in the water-ice content along these belts is responsible for the bad agreement between the model and the averaged observations in the southern high-latitude belts. To check this possibility, we performed a detailed study of the southern near-polar region using a large number of tested regions (see Table 2). For each of the 74 regions we tested the homogeneous model independently and found the best estimates for the water content ζhom(*) and the minimums Smin(ζhom(*)) of functional (1). Based of the tests, we constructed a distribution of the minimums of functional (1) (see Fig. 3). This distribution significantly differs from the theoretical χ32 distribution, which is to be observed in the case if the homogeneous model fits the observations.
If the homogeneous model of the material does not fit the observation data well, the next in complexity model to test is the two-layer soil model. It is assumed in this model that 98% of its upper layer consist of the material with the element composition corresponding to the Mars Pathfinder measurement data. The rock to soil ratio is 50% to 50%. The remaining 2% of mass belong to water. The thickness of this layer hup (g/cm2) is a free parameter. We call this layer "dry" hereafter. A lower layer lies below the upper one, and the aforementioned mixture of rocks and soil composes (100 – ζdown)% of its mass, while water fraction is ζdown%. The water content parameter ζdown in the lower "wet" layeris also a free one.
To verify the two-layer model with the two free parameters, we used five independent signals obtained by four detectors of the HEND instrument. We used three signals from epithermal and fast neutrons in the 3He counters and two signals from high-energy neutrons in the (0.85–2.5) MeV and above 2.5 MeV integry energetic channels of the stilbene scintillator. Thus, to verify the two-layer model, we had to compare the results of the minimization of the functional S(ζup, ζdown) with the same χ32 distribution as we used for the homogeneous model (see above).
The two-layer model was tested for high-latitude belts around the southern pole of Mars (Table 1). It turned out that the addition of the free parameter (the thickness of the upper dry layer) results in a quiet good agreement with the observation data. In the southern "permafrost region," the layer saturated with water ice is located below a thin dry soil layer with a typical column density of about 16–25 g/cm2. The average waterice content is about 55% by mass in the whole subpolar region poleward 70°S and decreases to 25% by mass in the boundary latitude belt from 60° to 70°S. We can suggest that the region of the absolute minimum of the epithermal neutron flux in the southern subpolar region does not principally differ from the entire subpolar region as the estimates of the soil parameters are nearly the same for these two cases.
The statistical study of the 74 regions in the southern high-latitude region of Mars (Table 2) showed that the two-layer model provides the best fit to the observations for the entire set of these regions. The distribution of the minimums of functional (1) for these regions is in good agreement with the χ32 distribution law. The parameters (ζdown, hup) estimated for these regions make it possible to map the thickness of the upper dry layer and the water abundance in the lower layer of the southern "ice permafrost" region on Mars (Figs. 5 and 6).
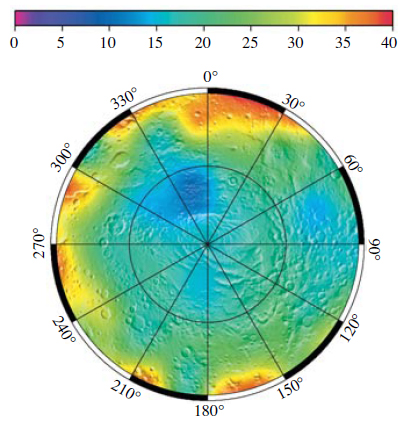
Fig. 5. The distribution of the surface density of the upper dry layer (g/cm2) in the southern ice permafrost region on Mars according to the two-layer model (the estimates, obtained for the 74 surface regions (Table 2), are smoothed by the high-resolution spatial filter).
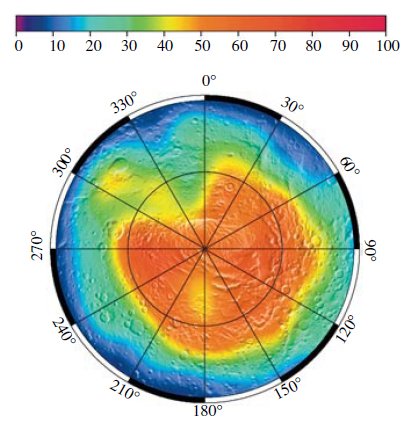
Fig. 6. The distribution of the water-ice content (% by mass) over the southern "ice permafrost" region on Mars according to the two-layer model (the estimates, obtained for the 74 surface regions (Table 2), are smoothed by the high-resolution spatial filter).
The boundaries of the water-ice content levels in the southern "ice permafrost" region are most shifted to low latitudes in the longitude sector from 60° to 150° E (Fig. 6). The region with a water-ice content of 20% by mass crosses the 60° S boundary in this sector. Outside the aforementioned longitude sector, the level of waterice content lies approximately along 65°. The boundary of the ice water content at a level of 50% by mass is as high as 82° S in the longitude sector from 300° to 360° E and, on the contrary, as low as approximately 68° S in the symmetric longitudinal sector 120°–180° E.
It is interesting to note that the region with high water-ice content and the south polar cap of carbon dioxide are shifted against each other along the meridians 150° and 330° E. The polar cap is "displaced" from the pole to the equator along the meridian 330° E, and the permafrost layer with an ice content of more than 50% by mass is shifted towards the equator along the meridian 150° E (see Fig. 6). We can suppose that the relative position of the polar cap and of the observed boundary of ice permafrost reflects the fact that the thick layer of carbon dioxide "dry ice" in the polar cap masks the water ice of the underlying surface from observations from the orbit. On the other side, there is a considerable amount of water ice (40–50% by mass) within the boundaries of the south polar cap, which indicates that the cap is a mixture of carbon dioxide dry ice and water ice in an approximately 1 : 1 proportion. The "minimal thickness" of the dry layer in the polar cap region (Fig. 5) also shows this. We can suggest that the water ice layer with a thickness of more than 1 m is located below the layer of carbon dioxide with a thickness of about 10 g/cm2 in the south polar cap.
ESTIMATION OF WATER CONTENT IN THE MID-LATIDUDE REGIONS WITH LOW NEUTRON FLUXES
Table 3 gives the water content estimated for four low-latitude regions of the low flux of epithermal neutrons (Fig. 1): the southern part of Hellas Planitia, the northern and southern regions of Arabia Terra, and the Medusae Fossae formation. Based on our experience in analyzing the measurement data for the northern and southern high-latitude ice permafrost regions, we used both the homogeneous soil model with the variable water-ice content and the two-layer model with the dry subsurface layer. In all the four cases both models proved to fit the neutron measurement data well. Here it is important to mention that each of the two models gives nearly similar estimates for the four different regions (Table 3). Thus, the homogeneous model gives a soil water content of 4.3–5.2% by mass in the four regions. According to the two-layer model, the water content is approximately twice as high in the lower layer and is ζdown = 9–10% by mass with the thickness of the upper relatively dry layer being approximately the same in all four regions and equal to hup = 26–32 g/cm2.
Table 3. Water content in low-latitude regions of Mars with a reduced epithermal neutron flux
| Region and Ls corresponding to its observation time | Region coordinates | Water content (in % by mass) estimated using homogeneous model * | Probability of adopting homogeneous model** | Water content (in % by mass) and water depth (g/cm2) estimated using two-layer model | Probability of adopting two-layer model |
| Southern Hellas Ls = (0°–150°) | 50°–98° E 47°–53° S |
4.3 (5.0) | 0.8 (0.1) | 9.0 26.0 |
0.2 |
| Northern Arabia Ls = (0°–150°) | 0°–45° E 0°–30° N |
5.0 (5.1) | 0.7 (0.15) | 9.0 26.0 |
0.7 |
| Southern Arabia Ls = (0°–150°) | 0°- 45° E 0°–20° S |
5.2 (5.2) | 0.4 (0.02) | 10.0 32.0 |
0.25 |
| Medusae Fossae formation Ls = (0°–150°) | 180°–200° E 0°–25° S |
5.1 (5.1) | 0.5 (0.1) | 9.0 29.0 |
0.7 |
* The water content calculated for the homogeneous model with four independent signals is given in parentheses.
** The possibility of adopting the homogeneous model calculated using four independent signals is given in parentheses.
The fact that the confidence levels proved to be comparable for the homogeneous model and the two-layer one and, judging from these levels, both these models can be adopted means that the observation data used to test these models are not complete enough to provide us a possibility of making a choice between them. It should be kept in mind that we applied four independent neutron measurements to verify the homogeneous model: the counts obtained by three proportional 3He counters and the total number of counts in all channels of the scintillation detector. Verifying the two-layer model, we partitioned the counts obtained in the scintillator detector into two energy intervals: from 0.85 MeV to 2.5 MeV and above 2.5 MeV. To make the decision whether we should distinguish between the homogeneous model and the two-layer one, we verified the homogeneous model against the data of five independent measurements, separately using the scintillator counts in the two aforementioned intervals.
The water content practically does not change in this case, while the values of minimums of functional (1) considerably increased. When we used the five independent measurements with the separately considered channel for neutrons with high energies above 2 MeV, the possibilities of adopting the homogeneous soil model (see figures in brackets in Table 3) turned out to be lower than those estimated for the two-layer model. The isolation of the signal from neutrons with energies above 2.5 MeV can qualitatively change the verification results for the homogeneous soil model as these neutrons are produced just below the surface at a depth of about 10 cm and it is these neutrons that are most strongly affected by the presence or absence of the upper dry layer. When the counts for the integral energetic measurement interval > 0.85 MeV in the scintillation detector are used, calculations and measurements are compared for a much thicker surface layer. As a result, the difference between the homogeneous model and the two-layer one becomes insignificant.
Thus, the data presented in Table 3 for the homogeneous model are rejected when we use the data for the five measurements including the counts for neutrons with energies above 2.5 MeV. The estimates based on the two-layer soil model (Table 3) should be used for the water content in the aforementioned low-latitude regions.
Comparing the mid-latitude zones, we see that there is a noticeable jump by a factor of 4–5 between the water content in the homogeneous soil of "dry" regions of Argyre Planitia (about 2% by mass) and the northern part of Hellas Planitia and the water content in the lower layer of the two-layer soil (9–10% by mass) in Arabia Terra, the southern part of Hellas Planitia, and the Medusae Fossae formation. It should be taken into account that the water content in the upper soil layer for the indicated "wet" regions is comparable with that in the soil of the "dry" regions. We can suppose that two forms of water can exist in the mid-latitude subsurface soil: the water of the "dry" soil with its content of about 2–3% by mass, which can be present at all depths and directly under the surface, and the water of the "wet soil", which can make >9% by mass and can be located at a depth of not less than 30 g/cm2.
The water contents estimated for different mid-latitude regions of Mars have typical values in the 2–3% interval and in the interval around 10%. The values from 4 to 9% are practically not observed. This leads us to the conclusion that the aforementioned water content intervals are associated with different physical conditions of water accumulation and presence in the soil.
It is known that in the subequatorial regions of Mars, where no water ice can exist in the soil, water can be in the physically bound form (adsorbed water) and in the chemically bound form. The adsorbed water can arrive in the soil due to condensation from the atmosphere. To explain the presence of the chemically bound water, we need to suggest that special conditions characterized by a high water content were at this place so that soil minerals were able to absorb water molecules (hydration). To explain the 2–3% water mass fraction in the upper layer, we can raise a question of whether it is enough to consider the process of interaction with the atmosphere or we need to assume that the process of hydration of soil minerals took place in the past under conditions of their direct contact with water. The maximal estimate of the adsorbed water content in the soil is known to correspond to several percents by mass (Mohlmann, 2002). In this case, the assumption of the mineral hydration on the Martian surface is not necessary. There are also some other estimates, which correspond to much smaller content of adsorbed water of less than 0.1% by mass (see, for example, Basilevsky et al., 2003). In this case, the processes of mineral hydration are required to explain the 2–3% water mass fraction in the upper planetary layer, and the current theories of climate evolution should provide for such conditions in the past history of the Martian climate.
The 10% mass fraction of water in the lower layer at a depth of more than 30 g/cm2 is possibly too large to have been condensed from the present atmosphere. In addition, if the water has been condensed from the atmosphere and adsorbed at such a depth, it should "fill" the upper soil layers, which are found to be relatively dry. Thus, the lower-layer water can be either chemically included into molecules of the soil material or in the free-ice form. The selection between these two possibilities can be made from analyzing the conditions of water accumulation in any form in the study region. For this purpose, we must estimate the maximal water content in the lower soil layer.
The region of Arabia Terra is large enough in comparison with the scale of spatial resolution on the planetary surface. In this region we chose a set of 4° × 4° test regions, which were independently studied using the two-layer soil model. In all cases this model was found to be consistent with observation data and allowed us to estimate soil parameters. It was found that the region centered at 10° N and 30° E corresponds to the highest estimate of the water content in the lower soil layer, about 16% by mass, and the thickness of the upper relatively dry layer was estimated to be 29 g/cm2 in this case. The estimated dry-layer thickness is in good agreement with the value obtained for the entire region of northern Arabia Terra; thus, the high water content cannot be related to the uncertainty of the model-dependent estimate.
The spread of water contents in individual regions of Arabia Terra is quite large (see Fig. 7). This spread cannot probably be explained by statistical fluctuations of the recorded counts. It reflects real differences in the parameters ζdown and hup at different surface areas. Further, the parameters of the two-layer soil model must be compared to different parameters describing geologic or geochemical properties of the surface regions. Such a comparison will help to reveal the physical nature of this difference.
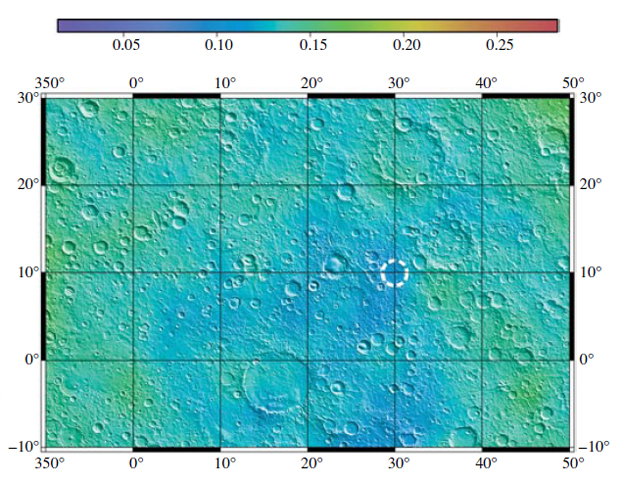
Fig. 7. The map of the epithermal neutron flux (counts per second in the MD detector of the HEND instrument) for the northern region of Arabia Terra. The region with the expected highest soil water content is marked by the circle.
Thus, based on the available data collection, we can conclude that the low-latitude region with the highest estimate of the water content below the surface (of about 16% by mass) is located between the craters Cassini and Schiaparelli and has coordinates of about 30° E and 10° N.
The limiting estimate obtained for the water content in the soil of Arabia Terra, probably, makes the current theory of climate evolution on Mars to face a serious problem. Really, if water is chemically bound in the soil of Arabia Terra, it is necessary to explain the cause of the difference between its content in the upper and lower soil layers (2–3% and 10–16% by mass, respectively). It is known that quite high temperatures of 350– 500°C are necessary for the mineral dehydration (see, e.g., Basilevsky et al., 2003); therefore, it is difficult to imagine that the conditions favorable for the loss of chemically bound water from minerals of the upperlayer with a column density of about 30 g/cm2 and its preservation below this layer have even been formed during the history of Mars.
If the lower-layer water has the free-ice form, another question arises about the accumulation of this ice in the soil of Terra Arabia and its conservation under the present conditions (see Paige, 1992). The answer to the raised questions should be found from a combined study of the data from present and future projects, which will provide the possibility of comparing the results of the orbital mapping with the surface-based measurements.
We showed that the regions of Mars with the brightest neutron emission contain about 2% of water by mass. These regions are Solis Planum, Argyre Planitia, the northern part of Hellas Planitia, etc. They are colored from red to green in the maps of epithermal neutrons from Mars (Fig. 1). The soil water in these regions was probably adsorbed in the form of thin monomolecular layers on the particle surfaces due to the interaction between the subsurface soil layers and the atmosphere.
We developed the soil model for vast subpolar regions of Mars with a considerably lowered epithermal neutron flux. These regions are dark blue in the map of epithermal neutrons from Mars. We demonstrated that good agreement between the observation data and the model predictions in the northern subpolar regions is achieved even within the framework of the homogeneous model. The estimate of water distribution in the northern subpolar region is presented in Fig. 4. On the contrary, the observation data for the southern subpolar region are not consistent with the homogeneous model. The soil should be described as a two-layer structure with an upper dry layer and a lower wet layer in this case. The distributions of parameters of the thickness of the upper "dry" layer and water content in the lower wet layer are given in Figs. 5 and 6.
The maximal water content in the soil of the northern and southern subpolar regions is more than 50% by mass. Practically confidently we can state that the soil water in the subpolar regions is in the form of water ice. This ice should fill the bulk of the subsurface-layer material; thus, its amount cannot be explained by the process of filling the entire porous soil volume with water. The water ice is the main rock-forming element in the subpolar regions, occupying the layers starting from the uppermost one in the north. In the south, it is covered by the relatively dry soil layer with a column density of 16–25 g/cm2.
The water contents estimated for different mid-latitude regions of Mars have typical values in the 2–3% interval and around 10%. We practically do not see values from 4 to 9%. This leads us to the conclusion that the aforementioned values of the water content are related to different forms in which water is present in the soil. Our results mean that the work on neutron mapping of Mars should be continued in order to accumulate statistics of the measurement data. It is necessary to go on with the development of new methods, which should improve the horizontal resolution and make it possible to estimate water contents for minimal in size surface regions.
The results obtained for the water content in the subsurface layer of Mars require a development of theoretical concepts about the formation of the Martian surface and the accumulation of water in subpolar regions and in the equatorial regions of low neutron flux. A combined processing of the neutron measurement data and measurements obtained by other instruments in different electromagnetic ranges (gamma, optical, infrared, ultraviolet, and radio) is one of the promising directions of future studies of the Martian surface.
The authors thank the referees for useful remarks. The authors are also grateful to the staff of the NASA 2001 Mars Odyssey project, who made it possible to map Mars from the orbit. This study was supported in part by the Russian Foundation for Basic Research (projects no. 03-05-64900-a and 03-02-16644-a).
1. Basilevsky, A.T., Litvak, M.L., Mitrofanov, I.G., et al., Search for Traces of Chemically Bound Water in the Martian Surface Layer Based on HEND Measurements onboard the 2001 Mars Odyssey Spacecraft, Astron. Vestn., 2003, vol. 37, no. 5, pp. 423–434 [Sol. Syst. Res. (Engl. Tramsl.), 2003, vol. 37, no. 5, p. 387].
2. Boynton, W.V., Chamberlain, M., Feldman, W.C., et al., Abundance and Distribution of Ice in the Polar Regions of Mars: More Evidence for Wet Periods in the Recent Past, 6th Int. Conf. on Mars, Pasadena, 2003, Abstract no. 3259.
3. Boynton, W.V., Feldman, W.C., Squyres, S.W., et al., Distribution of Hydrogen in the Near Surface of Mars: Evidence for Subsurface Ice Deposits, Science, 2002, vol. 297, pp. 81–85.
4. Boynton, W.V., Taylor, G.J., Hamara, D., et al., Compositional Diversity of the Martian Crust: Preliminary Data from Mars Odyssey Gamma-Ray Spectrometer, LPSC XXXIV, 2003, Abstract no. 2108.
5. Economou, T.E., Foley, C.N., and Clayton, R.N., The Chemical Composition of Martian Samples—Final Results from the Pathfinder Alfa Proton X-ray Spectrometer, 6th Int. Conf. on Mars, Pasadena, 2003, Abstract no. 3155.
6. Feldman, W.C., Boynton, W.V., Prettyman, T.N., et al., Growth of CO2 Frost Thickness Near Chasma Borealis during Northern Winter and Spring, LPSC XXXIV, 2003, Abstract no. 1854.
7. Feldman, W.C., Boynton, W.V., Tokar, R.L., et al., Global Distribution of Neutrons From Mars: Results From Mars Odyssey, Science, 2002, vol. 297, pp. 75–78.
8. Feldman, W.C., Maurice, C., Binder, A.B., et al., Fluxes of Fast and Epithermal Neutrons From Lunar Prospector: Evidence for Water Ice at the Lunar Poles, Science, 1998, vol. 281, pp. 1496–1500.
9. Haberle, R.M., Pollack, J.B., Barnes, J.R., et al., Mars Atmospheric Dynamics as Simulated by the NASA AMES General Circulation Model. I—the Zonal-Mean Circulation, J. Geophys. Res., 1993, vol. 98, pp. 3093–3123.
10. Jakosky, B.M. and Farmer, C.B., The Seasonal and Global Behavior of Water Vapor in the Mars Atmosphere—Complete Global Results of the Viking Atmospheric Water Detector Experiment, J. Geophys. Res., 1982, vol. 87, p. 2999.
11. Kieffer, H.H. et al., Mars South Polar Spring and Summer Temperatures—a Residual CO2 Frost, J. Geophys. Res., 1979, vol. 84, p. 8263.
12. Kieffer, H.H., Martin, T.Z., Chase, S.C., et al., Martian North Pole Summer Temperatures—Dirty Water Ice, Science, 1976, vol. 194, p. 1341.
13. Litvak, M.L., Mitrofanov, I.G., Kozyrev, A.S., et al., Seasonal Neutron-Flux Variations in the Polar Caps of Mars as Revealed by the Russian HEND Instrument Onboard the NASA 2001 Mars Odyssey Spacecraft, Astron. Vestn., 2003, vol. 37, no. 5, pp. 413–422 [Sol. Syst. Res. (Engl. Transl.), 2003, vol. 37, no. 5, p. 378].
14. Malin, M.C. and Edgett, K.S., Evidence for Recent Groundwater Seepage and Surface Runoff on Mars, Science, 2000, vol. 288, p. 2330.
15. Mitrofanov, I.G., Anfimov, D.S., Kozyrev, A.S., et al., Maps of Subsurface Hydrogen From High Energy Neutron Detector, Science, 2002, vol. 297, pp. 78–81.
16. Mitrofanov, I.G., Litvak, M.L., Kozyrev, A.S., et al., Search for Water in Martian Soil Using Global Neutron Mapping by the Russian HEND Instrument Onboard the US 2001 Mars Odyssey Spacecraft, Astron. Vestn., 2003, vol. 37, no. 5, pp. 400–412 [Sol. Syst. Res. (Engl. Transl.), 2003, vol. 37, no. 5, p. 366].
17. Mohlmann, D., Adsorption Water in Mid and Low Latitude Martian Soil, 2nd Europ. Workshop on Exo/Astrobiology, 2002, SP-518, pp. 169–172.
18. Paige, D.A., Herkenhoff, K.E., and Murray, B.C., Mariner 9 Observations of the South Polar Cap of Mars—Evidence for Residual CO2 Frost, J. Geophys. Res., 1990, vol. 95, p. 1319.
19. Paige, D.A., The Thermal Stability of Near-Surface Ground Ice on Mars, Nature (London), 1992, vol. 356, P. 43–45.
20. Rieder, R., Economou, T., Wanke, H., et al., The Chemical Composition of Martian Soil and Rocks Returned by the Mobile Alpha Proton X-Ray Spectrometer: Preliminary Results From the X-Ray Mode, Science, 1997, vol. 278, p. 1771.
