")
")
Long-Term Observations of the Evolution of the Southern Seasonal Cap of Mars: Neutron Measurements by the HEND Instrument onboard the 2001 Mars Odyssey Spacecraft
M. L. Litvaka, I. G. Mitrofanova, A. S. Kozyreva, A. B. Sanina, V. I. Tret'yakova, W. V. Boyntonb, D. Hamarab, and S. Saundersc
aSpace Research Institute, Russian Academy of Sciences, Profsoyuznaya 84/32, Moscow, 117997 Russia
b Lunar and Planetary Laboratory, University of Arizona, Tucson, AZ 85721, USA
c Jet Propulsion Laboratory, Pasadena, CA 91109, USA
Abstract - We present the results of five-year observations of the southern seasonal cap of Mars based on neutron spectroscopy of the surface fulfilled by the Russian HEND instrument onboard the NASA 2001 Mars Odyssey spacecraft. The numerical modeling of the observational data allowed us to reconstruct the curves of the variations of the total mass of the southern seasonal cap of Mars for different years (three Martian years) and to find the year-to-year variations of the seasonal cycle.
DOI: 10.1134/S0038094607050024 - http://www.springerlink.com/content/m162310844747320/
-------------------------------------------------------------------------------------------------------------------------------------------------
THE HEND INSTRUMENT: INTERPRETATION OF MEASUREMENTS
PROCESSING PROCEDURES APPLIED TO THE RESULTS OF THE HEND MEASUREMENTS
MEASURING THE SURFACE DENSITY AND THE MASS
OF THE SOUTHERN SEASONAL CAP OF MARS
In this study, we consider the results of continuous long-term observations of the seasonal caps of Mars by the Russian HEND instrument onboard the Mars Odyssey spacecraft. The HEND instrument is designed to measure neutron fluxes from Mars over a wide energy range, from 0.4 eV to 15 MeV. The data used in the study were obtained during the period from February 2002, when the orbital mapping of the Martian surface started (the end of the aerobraking phase and the beginning of the global mapping phase of the Mars Odyssey mission), through February 2007. This long period covers 2.5 Martian years, allowing us not only to study the change of the seasonal caps of Mars within one seasonal cycle, but also to attempt to follow the year-toyear variations during several Martian years. In this paper, we mostly pay attention to the investigation of the southern seasonal cap, for which we compared three successive seasonal cycles.
On Mars, the seasonal variations are accompanied by the redistribution of the main component of the atmosphere (carbon dioxide) between the planetary poles. This process affects about 25% of the entire atmospheric mass (Leighton and Murray, 1966; Tillman et al., 1993). In fall, a moment comes when the temperature falls below the freezing point of carbon dioxide, which results in its condensation on the Martian surface in the form of a snow deposit. This process continues until late winter and involves not only high but also middle latitudes. The seasonal caps of Mars cover huge areas extending to the 50–60th parallel in each hemisphere. At the poles, the snow cap can be as thick as several meters. According to different estimates (Smith et al., 2001; Aharonson et al., 2004) based on the MOLA laser altimeter data, the snow depth can reach 1.5 m in the northern hemisphere. For the south pole, the estimated snow thickness varies from 0.9 m (Smith et al., 2001) to 2.5 m (Aharonson et al., 2004). At the periphery of the seasonal caps (the region of the 50–60th parallel), the thickness of the snow deposit is small and does not exceed several centimeters.
From early spring, the temperature rises, and the seasonal CO2 deposit starts to sublimate back to the atmosphere and completely disappears by early summer, uncovering the residual polar caps of Mars. It is known from the data obtained in the Viking 1 and 2 missions that the northern residual polar cap almost completely consists of water ice (Kieffer et al., 1976). In the southern hemisphere, summer is shorter (though warmer), winter is longer and colder, and, additionally, the surface elevation is higher than in the north. Consequently, the dry ice is not completely evaporated into the atmosphere, and, all-year round, the southern residual polar cap is covered with a carbon dioxide layer (Kieffer et al., 1979), where traces of water ice are observed in thawed patches (Titus et al., 2003; Bibring et al., 2004).
The seasons are in opposite phases in the northern and southern hemispheres. When it is winter in one hemisphere and the snow deposition and the seasonal cap are formed there, it is summer in the other hemisphere with no snow cover and with the seasonal cap reduced to the size of the residual polar cap. The situation changes with time, spring or fall comes to the corresponding hemisphere, and the snow cover starts to sublimate in one hemisphere, while the temperature decreases and the atmospheric carbon dioxide starts to condense on the surface in the other hemisphere. Winter comes to the hemisphere, where there was summer, and vice versa. The whole cycle covers one Martian year that is approximately equal to two years on Earth. This global process, swapping the atmospheric masses from one hemisphere to another, is one of the distinguishing and considerable features of the Martian climate.
The operation of the research GRS (gamma-ray spectrometer) suite (containing the HEND instrument among the others) onboard the Mars Odyssey spacecraft has shown that nuclear spectroscopy methods can be very successfully used for studying the seasonal caps of Mars, since they yield independent estimates of the distributions of the surface density and the mass of the snow deposit (Mitrofanov et al., 2003b; Feldman et al., 2003; Litvak et al., 2003; 2004; 2006; 2007; Kelly et al., 2006). The depth sensitivity of the HEND, NS, and GRS instruments (the components of the GRS suite) is about 1–1.5 m, which allows one to study practically all regions of the polar caps and to reconstruct their three-dimensional structure. Moreover, the data from nuclear experiments can be used for correcting the current climate models of Mars and for verifying the results of other observations of the seasonal caps of Mars such as, for example, those connected with the analysis of the seasonal variations in the gravitational field of Mars resulting from the redistribution of the atmospheric carbon dioxide between the planetary poles (Karatekin et al., 2005; 2006).
The neutron flux measured at the orbit cannot directly yield such physical parameters as the water content in the soil, the surface density of the precipitated carbon dioxide, or the snow deposit mass. To find these parameters, model-dependent methods of data processing must be applied. In our case, this is the numerical modeling of the neutron flux at the orbit of Mars with one free parameter, corresponding to the column density of the carbon dioxide deposit, and subsequent comparison with the measurement data. Then, minimizing the residuals between the measurement data and the model predictions, we can find the surface density of the carbon dioxide deposit that best fits the specified measurement set of the orbital neutron flux (Mitrofanov et al., 2004; Litvak et al., 2004; 2006; 2007).
Since numerical modeling is extremely time consuming, in the present study, we decided to concentrate on the analysis of the observations of the southern seasonal cap of Mars. Within the framework of this approach, we estimated the total mass of this cap, compared it with the data from other experiments and the predictions from climate models, and undertook a search for year-to-year variations in the seasonal cycle.
THE HEND INSTRUMENT: INTERPRETATION OF MEASUREMENTS
Search for Water/Water Ice in the Soil
The neutron albedo of Mars is generated in the subsurface layer of the planet under bombardment by charged particles (mainly protons) of cosmic rays freely penetrating through the thin Martian atmosphere. Cosmic-ray particles interact with nuclei of the rockforming elements and produce the fluxes of fast neutrons (Drake et al., 1988; Feldman et al., 1993). When the fast neutrons move to the surface, they are moderated and absorbed, since they interact with nuclei of the Martian soil materials in inelastic scattering and capture reactions, which takes the nuclei to excited states and results, therefore, in an emission of nuclear gamma lines corresponding to the elemental composition of the surface (Masarik and Reedy, 1996). The efficiency of the moderation of the fast neutrons is determined by the hydrogen content in the subsurface layer (Drake et al., 1988; Boynton et al., 2002; Mitrofanov et al., 2002; 2003b; 2004; Feldman et al., 1993; 2002; 2003; 2004). The presence of hydrogen in the Martian soil is explained by the presence of absorbed, chemically bound water or water ice (see, e.g., Soderblom, 1992; Basilevsky et al., 2003; Kuzmin et al., 2004). Numerical modeling of the nuclear processes allows one to use the regional variations in the neutron flux to estimate the distribution of water or water ice (Boynton et al., 2002; Mitrofanov et al., 2002; 2003a; 2003b; 2004; Feldman et al., 1993; 2002; 2003; 2004; Prettyman et al., 2004).
Watching the Martian Seasonal Cycle
Not only regional but also seasonal variations of the neutron flux were found during long-term observations from the Martian orbit (Mitrofanov et al., 2003b; Feldman et al., 2003; Litvak et al., 2003; 2004; 2005; 2006). It was shown that the seasonal variations of the amplitude of the neutron signal are connected with the sublimation/ condensation of the snow deposit from the atmospheric carbon dioxide in high-latitude regions of Mars (Mitrofanov et al., 2003b; Feldman et al., 2003; Litvak et al., 2003).
It turned out that the presence of water ice in the high-latitude regions of Mars and a high sensitivity of the neutron measurements to the seasonal changes in the Martian climate are connected. During summer, when the surface is free of the seasonal CO2 deposit, the moderation of the flux of fast and epithermal neutrons is determined by the presence of a large amount of subsurface water ice in the upper soil layers (at a depth of less than 1 m). In fall and winter, a layer of frozen atmospheric carbon dioxide is formed on the surface; its thickness is comparable to or even more than the characteristic depth, at which fast neutrons are produced. Even for the CO2 deposits with a thickness of several centimeters, the effective layer, where neutrons are pro duced, moves upward and partially includes the uppermost carbon dioxide layer. Since there are no hydrogen nuclei in the snow deposit (the amount of condensed moisture is minimal there), the conditions for the moderation of fast and epithermal neutrons change. The moderation efficiency decreases, and the flux of epithermal and fast neutrons increases compared to observations in summer. A further growth of the snow deposit leads to a steep increase in the flux of fast and epithermal neutrons until the whole effective layer generating neutrons is within the frozen carbon dioxide. In this case, saturation takes place; and the neutron flux does not increase any more with a further thickening of the carbon dioxide cover. The difference between the summer and winter neutron fluxes was found to be substantial. The analysis of the first seasonal data obtained with the HEND instrument showed that variations in the amplitude of the neutron signal during a year were about 20%, not less than 70%, and more than 300% at the periphery of the seasonal caps ( ∼60° N/S), at latitudes of ∼75° N/S, and at the polar latitudes ( >85° N/S), respectively (Litvak et al., 2003).
The data volume used in the present study allowed us to compare three different winters in the southern hemisphere. This is better than what we did in our previous works (one winter period was analyzed by Litvak et al. (2003; 2006) and two periods were considered in Litvak et al. (2007)). Figures 1 and 2 present the seasonal profiles of the fluxes of epithermal and fast neutrons registered by the HEND instrument in the southern hemisphere during five years of its operation on the Martian orbit. Different symbols correspond to the different years of the winter observations.
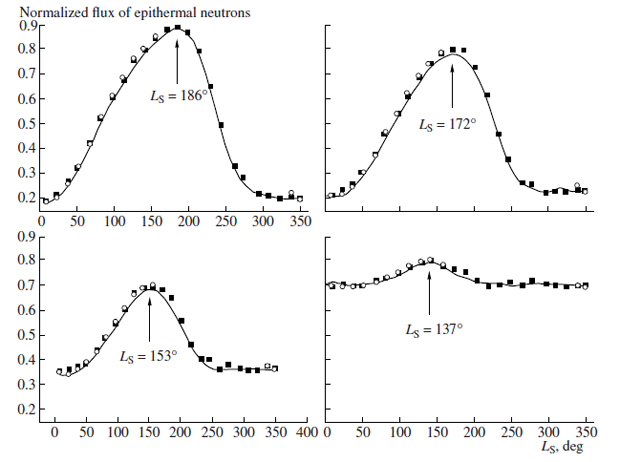
Fig. 1. The seasonal curves of the orbital flux of epithermal neutrons constructed for different latitudes of the southern seasonal cap of Mars. The data for the 50°–60°S, 60°–70°S, 70°–80°S, and 80° 90°S latitude belts are shown in the lower right, lower left, upper right, and upper left plots, respectively. The data for the first, second, and third years of the orbital observations from the Mars Odyssey spacecraft are shown with a solid line, squares, and circles, respectively. In each plot, the moments of the maximum (the mid-winter for the specified latitude belt) are indicated.
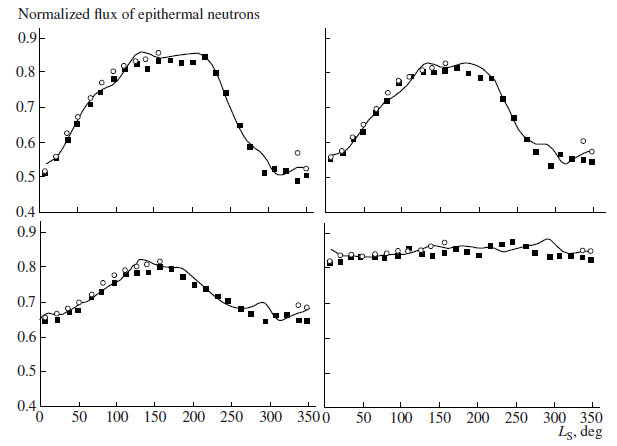
Fig. 2. The seasonal curves of the orbital flux of fast neutrons constructed for different latitudes of the southern seasonal cap of Mars. The data for the 50°–60°S, 60°–70°S, 70°–80°S, and 80°–90°S latitude belts are shown in the lower right, lower left, upper right, and upper left plots, respectively. The data for the first, second, and third years of the orbital observations from the Mars Odyssey spacecraft are shown with a solid line, squares, and circles, respectively.
Summer and Winter Observations
The measurement of the seasonal variations of the neutron flux showed that there are two types of observations based on the neutron spectroscopy of the Martian surface, which correspond to different scientific tasks.
The first direction includes the examination of the surface free of carbon dioxide. This is based on the data from continuous observations of low-latitude regions and on the data from measurements at high latitudes during summer. These studies allow one to find the global water distribution in the subsurface layer of Mars and the mineralogical composition of this layer. The result of the studies in this direction is associated with the discovery of regional variations in the fluxes of epithermal and fast neutrons; the fluxes in the polar and equatorial regions of the planet may differ by a factor of up to 10 (Mitrofanov et al., 2002; 2003; Feldman et al., 2002). The numerical modeling of the subsurface soil structure demonstrated that the observed effect can be explained by the presence of about 50–80 mass % of water ice near the surface (northern polar latitudes) at a small depth of 10–30 cm (southern polar latitudes) (Mitrofanov et al., 2004; Litvak et al., 2006; Prettyman et al., 2004).
The purpose of the second direction of studies is the investigation of the dynamics of seasonal carbon dioxide depositions based on observations of the neutron flux variations at high latitudes. These are actually the year-round observations covering the time period from early fall to early summer in each hemisphere. The use of a numerical model accounting for the soil structure and composition (obtained within the first direction of studies) and the thickness of the snow deposit formed due to the carbon dioxide precipitation allows one to reconstruct the surface density (g/cm2 ) and the snow cover mass for different areas of the seasonal caps. Previous investigations showed that the surface density of the seasonal deposit may vary from 30 (in the latitude band from 60° to 70° N) to 65 g/cm2 (in the 80°–90° N latitude band) for the northern seasonal cap and from 40 (in the 60°–70° S latitude band) to 90 g/cm2 (in the latitude band from 80° to 90° S) for the southern seasonal cap. The total mass of the northern and southern seasonal caps was estimated at (3.8±0.2)×1015 and (6.3±0.3)×1015 kg, respectively (Litvak et al., 2004; 2005; 2006; 2007; Feldman et al., 2003).
PROCESSING PROCEDURES APPLIED TO THE RESULTS OF THE HEND MEASUREMENTS
Estimating the Background
The HEND instrument includes four detectors capable of recording neutrons of different energies. Three of them are constructed from 3He neutron proportional counters. Their main purpose is to record the epithermal and fast neutrons with energies from 0.4 eV to 1 MeV. Each proportional counter is covered with a cadmium layer (absorbing thermal neutrons) and with a moderator (polyethylene) layer of a different thickness. Epithermal neutrons are first moderated and then registered in the counter volume. According to the moderator thickness, the detectors are called SD (small detector), MD (medium detector), and LD (large detector). To record fast neutrons, the organic stilbene crystal is used. It is protected from cosmic-ray protons with the surrounding anticoincidence CsI shield. Moreover, a special separation circuit was designed to separate the channels for recording neutrons and gamma-quanta using the impulse shape. An extended description of the HEND instrument can be found in the papers by Mitrofanov et al. (2003a), Boynton et al. (2004), and Litvak et al. (2006).
The signal in each detector (on the orbit of Mars) consists of the useful signal (neutrons coming from the Martian surface and recorded by the HEND detectors) and the background. In its turn, the background contains several components: the background of galactic cosmic rays (neutrons originating from the spacecraft materials under the influence of cosmic rays) and the scattered neutrons (neutrons coming from Mars and registered in the volumes of the HEND detectors after being scattered one or many times in the spacecraft materials). To take into account the first background component, the data obtained during the flight and aerobraking of the Mars Odyssey spacecraft were used. At that time, the spacecraft was far from Mars, and the useful signal and the background from the scattered neutrons were zero (see Litvak et al., 2003; 2006; 2007). The second background component (scattered neutrons) is proportional to the neutron flux coming from Mars. The numerical estimates show that it is several times lower than the galactic background. To minimize its contribution to the useful signal, the normalization of the measurement data is used (see below).
The galactic background is variable, since the flux of cosmic rays is modulated by solar activity, and it changes cyclically during the 11-year solar cycle. In our study, we used numerical modeling of the HEND data to estimate such variations in the galactic background and to eliminate them from the data analysis.
In addition to the above causes, the useful signal is distorted during solar flares, when the flux of charged particles bombards the spacecraft material for several days and induces an increase in the background signal by tens or even hundreds of times. Therefore, all of the time intervals corresponding to high solar activity were removed from the analysis of the seasonal data.
Normalization
The production of neutrons in the subsurface layer of Mars changes with time, because it depends on the variable flux of cosmic rays. These changes are mainly caused by the increase/decrease in the solar activity during the 11-year solar cycle, when the flux of cosmic rays can change by several times. It was found that, during five years of measurements, the useful signal in each HEND detector varied within a factor of two due only to the solar variations in the cosmic-ray flux. Such a change should be taken into account in the analysis of the seasonal neutron-flux variations, which are associated with the precipitation/sublimation of atmospheric carbon dioxide. For this purpose, the whole sequence of observations was partitioned into time intervals; within each of these intervals, the data were normalized and the cosmic-ray flux was estimated. To do this, the observations of the neutron flux in the Solis Planum region were used. This is one of the driest regions on Mars, located near the equator (it was assumed in the numerical analysis that the water distribution in this region is uniform and the water content is less than 2% in mass). In this region, possible variations in the neutron flux at different time moments are not associated with hydrologic activity or seasonal changes, but are determined by variations in the flux of cosmic rays, by solar activity, or by systematic errors in instrument operation (see Litvak et al., 2003; 2004; 2005; 2006; 2007; Mitrofanov et al., 2004).
While normalizing the data for each time interval and for each HEND detector, we estimated the average neutron fluxes from different areas of the seasonal caps and from the Solis Planum region. Then, the measurements corresponding to the seasonal caps were normalized to the neutron flux obtained for Solis Planum. Under this approach, when the data obtained for different time intervals are compared, the effect of the variations in cosmic rays and the systematic errors associated with the temperature dependence of the analog electronics and the degradation of the amplification factor (see Litvak et al., 2003; 2004; 2005; 2006; 2007; Mitrofanov et al., 2004) are minimized. The normalized seasonal curves of the flux of epithermal and fast neutrons are shown in Figs. 1 and 2.
A Numerical Model of the Neutron Albedo of Mars
As has been already mentioned in the Introduction, to find the surface density or the mass of the frozen carbon dioxide layer on the surface of the planet from the seasonal variations in the neutron flux, it is necessary to develop a model of orbital measurements, which should take into account all of the factors responsible for the production of neutrons and their scattering along the path from the point of their production in the subsurface layer to the detector. With such a model, the neutron flux on the orbit can be numerically simulated and compared with the measurement data. This is called the model-dependent reconstruction of the data. The simplest version of the numerical model includes three different layers, where the neutron flux is formed. They are the Martian atmosphere, the seasonal carbon dioxide deposit, and the Martian soil. The numerical model and its parameters have been described in detail by Litvak et al. (2003; 2004; 2005; 2006; 2007) and Mitrofanov et al. (2004).
Since our main purpose is to calculate the thickness of the snow cover, we separated the winter and summer observations and fixed the Martian soil parameters obtained during summer observations (Mitrofanov et al., 2004; Litvak et al., 2006). The free parameter of the numerical model was the surface density (g/cm2 ) of the frozen carbon dioxide layer. According to the math ematical procedure described by Mitrofanov et al. (2004) and Litvak et al. (2006; 2007), in the modeldependent reconstruction of the HEND data, the function of residuals between the measurement data and the predictions of the model with a varied free parameter was minimized. The measurement data were the normalized seasonal curves, and the model predictions were the convolution (normalized to the flux of cosmic rays for the seasonal interval specified) of the model neutron flux and the sensitivity functions of different HEND detectors.
Selection and Classification of the Observational Data
The spatial resolution of the HEND instrument is determined by the height of the spacecraft orbit and by the neutron flux collimation in the atmosphere. According to the numerical modeling, the spatial resolution of the HEND instrument is specified by a circle area about 400–600 km across.
In the present study, we use the "large-domain" approximation, according to which the area occupied by the southern seasonal cap of Mars was partitioned into latitude belts exceeding the spatial resolution of the HEND instrument. Four latitude belts were selected: 50°–60° S, 60°–70° S, 70°–80° S, and 80°–90° S. Such a partition allowed us not only to simplify the spatial analysis in the data processing and to reduce the computational time, but also to increase the observation statistics and to distribute the whole observational period into a larger number of seasonal intervals than had been suggested in previous studies (Litvak et al., 2004; 2006). For the first time, this type of partition was used in the work by Litvak et al. (2007).
By the time of observations, the entire data volume was partitioned into several large datasets corresponding to three Martian years. For the first and second Martian years of the Mars Odyssey operation on the orbit, 24 seasonal intervals were selected, and 13 intervals were chosen for the third year (see Figs. 1 and 2). The duration of each interval was about ∼15° of solar longitude (Ls). For the first and second Martian years, the selected intervals completely describe the dynamics of the southern seasonal cap of Mars. For the third year, the observation data are available only until the middle of the southern winter (Ls = 170°).
For all seasonal intervals, numerical modeling was performed, and the surface density and the mass of the seasonal deposit were estimated (see the next section).
MEASURING THE SURFACE DENSITY AND THE MASS OF THE SOUTHERN SEASONAL CAP OF MARS
Estimating the Surface and Volume Density of the Seasonal Deposit
In this section, to estimate the surface density and the mass of the seasonal deposit at different latitudes, we use the seasonal curves of the neutron flux and the technique described in the previous sections and publications (Mitrofanov et al., 2004; Litvak et al., 2005; 2006; 2007). As an example of these calculations, Fig. 3 shows the estimated surface density of the seasonal deposit in the 80°–90° S latitude belt for different Martian years. In addition, this figure also presents the predictions for a general circulation model of Mars' climate. In contrast to our recent work (Litvak et al. 2007), we added the data from the measurements obtained during the third Martian year, so that the possible dynamics of the year-to-year variations in the seasonal cycle could be demonstrated more clearly.
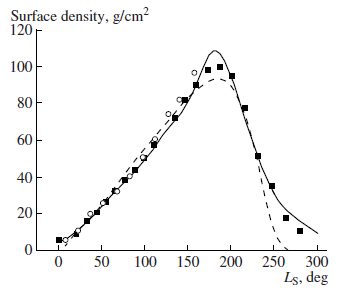
Fig. 3. The seasonal curves of the surface density of frozen carbon dioxide obtained for the 80° –90° S latitude belt for different Martian years. The data for the first, second, and third years of the orbital observations from the Mars Odyssey spacecraft are shown by a solid line, squares, and circles, respectively. The dashed line presents the GCM predictions.
The results of calculations performed for different latitude belts within the southern seasonal cap have shown that the surface density varies from 15 g/cm2 at the periphery of the seasonal cap (in the latitude belt between 50° and 60° S) to 115 g/cm2 at the polar latitudes (in the latitude belt between 80° and 90° S), and the maximum thickness of the seasonal deposit moves from Ls = 140° at the seasonal cap periphery to 185° at the polar latitudes. The lifetime of the southern seasonal cap ΔLs is 260°–280° (at the polar latitudes, the first noticeable snow layer appears at about Ls = 10° and completely sublimates at Ls > 280°). We will not dwell here on the dynamics of the seasonal curves of the surface density obtained from the HEND data, since this problem has been already discussed by Litvak et al. (2005; 2006; 2007). The obtained estimates vary weakly from year to year. A comparison of two southern Martian winters revealed that the maximal difference occurs at polar latitudes in mid-winter and is less than 10% (Litvak et al., 2007). In the present study, we tried to extend the boundaries of observations by invok ing the data for the third Martian year in order to observe a possible tendency in the year-to-year variations of the seasonal cycle. However, the comparison of three seasonal curves (covering three Martian years) for various latitudes shows that such year-to-year differences are minimal. No noticeable differences were found at the periphery and in the mid-areas of the southern seasonal cap. For the near-pole latitudes (80°– 90° S), the maximal differences in the snow cover thickness do not exceed 10–15%, which becomes substantially less evident due to measurement errors (10– 12%).
The behavior of the seasonal curves of the neutron flux presented in Figs. 1 and 2 is determined by variations in the column density of the seasonal deposit (Fig. 3) and is measured in g/cm3. To estimate the geometrical thickness of the seasonal deposit from the neutron data, the volume density (g/cm2) of the frozen carbon dioxide layer is required. If, vice versa, the task is to estimate the volume density of the snow cover, the data on the geometrical thickness are needed. Thus, to extend the field of parameters describing the snow deposit, a comparative analysis is necessary invoking the data from other experiments or climate models, which can provide estimates either of the volume density or the geometrical thickness of the snow deposit. Direct measurements of the seasonal deposit thickness (in centimeters) were fulfilled on the basis of the data from the laser altimeter MOLA onboard the Mars Global Surveyor spacecraft. The first results published by Smith et al. (2001) demonstrated that the thickness of the snow deposit at the southern polar latitudes may run to 90 cm. Several years later, the improved statistical analysis of the variations in individual measurements yielded much larger values of the maximal thickness, reaching ≈250 cm (Aharonson et al., 2004). A comparison of these estimates with the results from the HEND experiment (a maximal effective thickness of the frozen carbon dioxide layer amounting to 112 g/cm2) allows us to conclude that the volume density of the seasonal deposit may be as low as 0.4 g/cm3.
Measuring the Mass of the Seasonal Deposit
The thickness of the seasonal deposit cannot be directly measured using the nuclear spectroscopy method; however, this method allows us to estimate other important quantity, namely, the total mass of the seasonal caps. The mass of the seasonal deposit m within the area S is equal to ΔhS, where Δ is the density of the seasonal deposit and h is its average thickness. This formula can be presented as m = ξS, where ξ is the surface density or the effective thickness of the seasonal deposit obtained from neutron measurements. We can pass from the masses of precipitated carbon dioxide estimated in separate studied regions of the surface (in this specific case, in the four latitude belts: 50°–60° S, 60°–70° S, 70°–80° S, and 80°–90° S) to the total mass of the seasonal cap by summing up the results obtained for all latitude zones composing the southern seasonal cap. Figure 4 presents the seasonal curves of the total mass of the southern seasonal cap obtained for different Martian years. We see that the total mass of the southern seasonal cap is accumulated during the period from Ls = 150° to 170° and reaches 6.6±0.6×10¹⁵ kg. After this moment, the sublimation of the seasonal deposit dominates the condensation almost within the whole seasonal cap (except at the highest latitudes), and its mass starts to diminish. The seasonal curve of the total mass is almost symmetric: the duration of the right slope corresponding to the active sublimation of the seasonal deposit is shorter than the left one (the active formation of the seasonal deposit on the surface of the southern hemisphere) by only 20%. This is caused by the fact that the main contributor to the total mass of the seasonal cap is the zone of the temperate latitudes. The seasonal curves of the surface density of the precipitated carbon dioxide at these latitudes are more symmetric compared to those in the polar latitudes. The comparison of the curves corresponding to different years shows small differences in the snow deposition in the vicinity of the winter peak (Ls = 130°–150°), but they amount to 7–9% and do not exceed the measurement errors. It follows from the above that no substantial year-to-year variations of the seasonal cycle have been found on the basis of several Martian years.
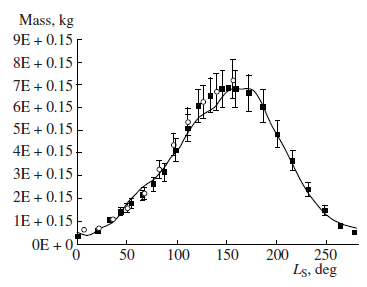
Fig. 4. The seasonal curves of the total mass of the southern seasonal cap of Mars obtained for different Martian years. The data for the first, second, and third years of the orbital observations from the Mars Odyssey spacecraft are shown by a solid line, squares, and circles, respectively.
In addition to searching for the year-to-year variations in the seasonal cycle on the basis of the HEND data, we compared these data with the results of other experiments and with model predictions. To this end, we applied the averaged curve of the total mass of the southern seasonal cap constructed from the HEND data for three Martian years (see Fig. 5).
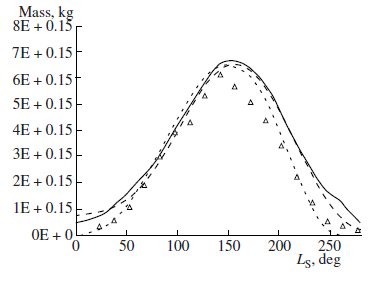
Fig. 5. The seasonal curves of the total mass of the southern seasonal cap of Mars based on data from different sources: the averaged (over three Martian years) values obtained from the HEND data (solid line), the GCM predictions (dotted line), the results of the analysis of the seasonal variations in the gravity field (Karatekin et al., 2006) (dashed line), and the estimates from the GRS experiment (triangles).
A comparison of the seasonal curves of the total mass obtained from the HEND data with the predic tions of the general circulation model (GCM) (Haberle et al., 1993) show a good agreement for the seasons with Ls = 50°–200° including the region of the winter maximum. On the other hand, the largest differences between these two methods can be observed during the spring phase of the snow cover sublimation with Ls = 200°–270° (the right slope of the seasonal curve of the total mass; see Fig. 4). In this interval of the seasonal cycle, the HEND data are substantially higher in the plot than the predictions of the climate model (this difference is larger than three standard deviations).
In the comparisons of the second type, we compared our results to the total mass estimated from the observational data of the gamma-spectrometer GRS (Kelly et al., 2006) and the neutron spectrometer NS (Prettyman et al., 2005). According to the GRS data, the total mass of the southern seasonal cap reaches its maximum at Ls = 142° and amounts to (6.1±0.25)×1015 kg (see Fig. 5). According to the NS data, the maximal mass of the southern seasonal cap, 5.4×10¹⁵ kg, was observed during the season with Ls = 165°. This analysis included the observational data for the latitudes from 60° to 90° S. According to the HEND data, the maximal mass of the snow cover in this latitude range varies to about 6.0×10¹⁵ kg. The analysis of these results allows us to conclude that the data of different experiments agree within the measurement error (the spread of values is less than 2).
One more comparison made in this study concerns the data of the gravity analysis of the trajectory data of the Mars Global Surveyor and Mars Odyssey spacecraft. One can judge on the variations in the gravity field caused by the redistribution of the atmospheric carbon dioxide between the Martian poles from the changes in the trajectory of such a massive body as the spacecraft, and the mass of the seasonal caps can be consequently estimated. A number of papers dwelling on this analysis have been published (Smith et al., 2001; Yoder et al., 2003; Karatekin et al., 2005; 2006). Recent estimates (Karatekin et al., 2006) agree well with the HEND data and confirm that the total mass of the southern seasonal cap is 6×10¹⁵ kg and reaches its maximum at Ls = 160° (see Fig. 5).
This paper presents the analysis of the data of neutron spectroscopy of the Martian surface obtained in the HEND experiment onboard the 2001 Mars Odyssey spacecraft during the period from February 18, 2002 to February 1, 2007. While considering such a huge amount of data, we tried to pay particular attention to the search for year-to-year variations of the seasonal cycle of Mars. The model-dependent deconvolution of the data with the usage of the annual variations in the Martian neutron albedo allows one to estimate the seasonal curves of the column density and the frozen carbon dioxide mass in different regions of the seasonal caps of Mars. Here, we concentrated on the analysis of the growth and sublimation of the southern seasonal cap. For this purpose, the southern seasonal cap was partitioned into four latitude belts, and the whole period of observations of one seasonal cycle was split into approximately 20 seasonal intervals. For each latitude belt and each seasonal interval, we performed the model-dependent deconvolution of the HEND data taking into account the seasonal dynamics of the atmosphere, the soil structure, and the column density of the frozen carbon dioxide layer. The latter was used as a free parameter of the numerical model that was varied for fitting the HEND data gathered for a specified region and a given seasonal interval.
The surface density of the seasonal deposit at different latitudes was estimated, and the seasonal curves of the total mass of the southern seasonal cap were constructed for three different Martian years. The observations corresponding to different years were compared, and no considerable changes in the growth and sublimation dynamics of the southern seasonal cap caused by year-to-year variations in the seasonal cycle were found. The largest discrepancy between the data from different years is less than 10%, which can be completely explained by errors in the measurements of the seasonal deposit mass.
It follows from our analysis that the mass of the southern seasonal cap of Mars reaches its maximum in the interval Ls = 150°–170° and amounts to 6.6±0.6×10¹⁵ kg. Within the measurement error, this value agrees with the GCM (general circulation model) predictions, estimates based on the experimental data from GRS and NS instruments, and the data on the seasonal variations of the gravitation field of Mars measured by the Mars Global Surveyor and Mars Odyssey spacecraft.
In the present work, we used the results of MOLA (laser altimeter) data processing to estimate the volume density of the seasonal deposit. The comparison of the HEND and MOLA data showed that the volume density of the seasonal deposit can be as low as 0.4 g/cm3.
On the whole, the analysis of the HEND data demonstrated that the neutron spectroscopy of the surface is an independent tool for studying the seasonal caps of Mars. It provides the possibility to estimate the distributions of the surface density and the mass of the seasonal deposit.
The authors are grateful to the reviewers for valuable comments. The authors thank all of those who designed and realized the NASA 2001 Mars Odyssey space mission.
This study was supported in part by the Russian Foundation for Basic Research (project no. 05-02- 16552-a).
1. Aharonson, O., Zuber, M.T., Smith, D.E., et al., Depth, Distribution, and Density of CO2 Deposition on Mars, J. Geophys. Res., Ser. E, 2004, vol. 109, p. 05004.
2. Basilevsky, A.T., Litvak, M.L., Mitrofanov, I.G., et al., Search for Traces of Chemically Bound Water in the Martian Surface Layer Based on HEND Measurements onboard the 2001 Mars Odyssey Spacecraft, Astron. Vestn., 2003, vol. 37, no. 5, pp. 423–434 [Sol. Syst. Res. (Engl. Transl.), vol. 37, no. 5, pp. 387–397].
3. Bibring, J.P., Langevin, Y., Poulet, F., et al., Perennial Water Ice Identified in the South Polar Cap of Mars, Nature, 2004, vol. 428, pp. 627–630.
4. Boynton, W.V., Feldman, W.C., Squyres, S.W., et al., Distribution of Hydrogen in the Near Surface of Mars: Evidence for Subsurface Ice Deposits, Science, 2002, vol. 297, pp. 81–85.
5. Boynton, W.V., Feldman, W.C., Mitrofanov, I.G., et al., The Mars Odyssey Gamma-Ray Spectrometer Instrument Suite, Space Sci. Rev., 2004, vol. 110, no. 1, pp. 37–83.
6. Drake, D.M., Feldman, W.C., and Jakosky, B.M., Martian Neutron Leakage Spectra, J. Geophys. Res., 1988, vol. 93, pp. 6353–6368.
7. Feldman, W.C., Boynton, W.V., Jakosky, B.M., et al., Redistribution of Subsurface Neutrons Caused by Ground Ice on Mars, J. Geophys. Res., 1993, vol. 98, pp. 20855– 20870.
8. Feldman, W.C., Boynton, W.V., Tokar, R.L., et al., Global Distribution of Neutrons from Mars: Results from Mars Odyssey, Science, 2002, vol. 297, pp. 75–78.
9. Feldman, W.C., Prettyman, O.I., Boynton, W.V., et al., CO2 Frost Cap Thickness on Mars During Northern Winter and Spring, J. Geophys. Res., Ser. E, 2003, vol. 108, no. 9. DOI: 10.1029/2003JE002101
10. Feldman, W.C., Prettyman, T.H., Maurice, S., et al., Global Distribution of Near-Surface Hydrogen on Mars, J. Geophys. Res., Ser. E, 2004, vol. 109, E09006. DOI:10.1029/2003JE002160
11. Haberle, R.M., Pollack, J.B., Barnes, J.R., et al., Mars Atmospheric Dynamics As Simulated by the NASA AMES General Circulation Model. I - The Zonal-Mean Circulation, J. Geophys. Res., 1993, vol. 98, pp. 3093–3123.
12. Karatekin, O., Duron, J., Rosenblatt, P., et al., Mars' Time- Variable Gravity and its Determination: Simulated Geodesy Experiments, J. Geophys. Res., Ser. E, 2005, vol. 110, E06001. DOI: 10.1029/2004JE002378
13. Karatekin, O., Van Hoolst, T., and Dehant, V., Martian Global- Scale CO2 Exchange from Time-Variable Gravity Measurements, J. Geophys. Res., Ser. E, 2006, vol. 111, E06003. DOI: 10.1029/2005JE002591
14. Kelly, N., Boynton, W.V., Kerry, K., et al., Seasonal Polar Carbon Dioxide Frost on Mars: CO2 Mass and Columnar Thickness Distribution, J. Geophys. Res., Ser. E, 2006, vol. 111, E03S07, DOI:10.1029/2006JE002678.
15. Kieffer, H.H., Mars South Polar Spring and Summer Temperatures - A Residual CO2 Frost, J. Geophys. Res., 1979, vol. 84, pp. 8263–8288.
16. Kieffer, H.H., Martin, T.Z., Chase, S.C., et al., Martian North Pole Summer Temperatures - Dirty Water Ice, Science, 1976, vol. 194, pp. 1341–1344.
17. Kuzmin, R.O., Zabalueva, E.V., Mitrofanov, I.G., et al., Regions of Potential Existence of Free Water (Ice) in the Near-Surface Martian Ground: Results from the Mars Odyssey High-Energy Neutron Detector (HEND), Astron. Vestn., 2004, vol. 38, no. 1, pp. 1–13 [Sol. Syst. Res. (Engl. Transl.), vol. 38, no. 1, pp. 1–11].
18. Leighton, R.B. and Murray, D.C., Behavior of Carbon Dioxide and Other Volatiles on Mars, Science, 1966, vol. 153, pp. 136 –144.
19. Litvak, M.L., Mitrofanov, I.G., Kozyrev, A.S., et al., Seasonal Neutron-Flux Variations in the Polar Caps of Mars as Revealed by the Russian HEND Instrument Onboard the NASA 2001 Mars Odyssey Spacecraft, Astron. Vestn., 2003, vol. 37, no. 5, pp. 413-422 [Sol. Syst. Res. (Engl. Transl.), vol. 37, no. 5, 378-386].
20. Litvak, M.L., Mitrofanov, I.G., Kozyrev, A.S., et al., Seasonal Carbon Dioxide Depositions on the Martian Surface as Revealed from Neutron Measurements by the HEND Instrument Onboard the 2001 Mars Odyssey Spacecraft, Astron. Vestn., 2004, vol. 38, no. 3, pp. 195– 206 [Sol. Syst. Res. (Engl. Transl.), vol. 38, no. 3, pp. 167–177].
21. Litvak, M.L., Mitrofanov, I.G., Kozyrev, A.S., et al., Modeling of Martian Seasonal Caps from HEND/Odyssey Data, Adv. Space Res., 2005, vol. 36, no. 11, pp. 2156– 2161.
22. Litvak, M.L., Mitrofanov, I.G., Kozyrev, A.S., et al., Comparison Between Polar Regions of Mars from HEND/Odyssey Data, Icarus, 2006, vol. 180, pp. 23–37.
23. Litvak, M.L., Mitrofanov, I.G., Kozyrev, A.S., et al., Long Term Observations of Southern Winters on Mars: Estimations of Column Thickness, Mass and Volume Density of the Seasonal CO2 Deposit from HEND/Odyssey Data, J. Geophys. Res., Ser. E, 2007, vol.112, E03S13, DOI:10.1029/2006JE002832
24. Masarik, J. and Reedy, R.C., Gamma Ray Production and Transport in Mars, J. Geophys. Res., 1996, vol. 101, Mitrofanov, I.G., Anfimov, D.S., Kozyrev, A.S., et al., Maps of Subsurface Hydrogen from High Energy Neutron Detector, Science, 2002, vol. 297, pp. 78–81.
25. Mitrofanov, I.G., Litvak, M.L., Kozyrev, A.S., et al., Search for Traces of Chemically Bound Water in the Martian Surface Layer Based on HEND Measurements onboard the 2001 Mars Odyssey Spacecraft, Astron. Vestn., 2003a, vol. 37, no. 5, pp. 400–412 [Sol. Syst. Res. (Engl. Transl.), vol. 37, no. 5, 387–397].
26. Mitrofanov, I.G., Zuber, M.T., and Litvak, M.L., CO2 Snow Depth and Subsurface Water-Ice Abundance in the Northern Hemisphere of Mars, Science, 2003b, vol. 300, pp. 2081–2084.
27. Mitrofanov, I.G., Litvak, M.L., Kozyrev, A.S., et al., Soil Water Content on Mars as Estimated from Neutron Measurements by the HEND Instrument Onboard the 2001 Mars Odyssey Spacecraft, Astron. Vestn., 2004, vol. 38, no. 4, pp. 291-303 [Sol. Syst. Res. (Engl. Transl.), vol. 38, no. 4, pp. 253–257].
28. Prettyman, T.H., Elphic, R.C., Feldman, W.C., et al., Spatial Deconvolution of Mars Odyssey Neutron Spectroscopy Data: Analysis of Mars Southern Seasonal Cap, Lunar and Planet. Sci. Conf. XXXVI, 2005, Abstract #1384.
29. Prettyman, T.H., Feldman, W.C., Mellon, M.T., et al., Composition and Structure of the Martian Surface at High Southern Latitudes from Neutron Spectroscopy, J. Geophys. Res., 2004, VOL. 109, E05001, DOI:10.1029/2003JE002139.
30. Smith, D.E., Zuber, M.T., and Neumann, G.A., Seasonal Variations of Snow Depth on Mars, Science, 2001, vol. 294, pp. 2141–2146.
31. Soderblom, L.A., The Composition and Mineralogy of the Martian Surface from Spectroscopic Observations - 0.3 Micron to 50 Microns, Mars Book. Space Sci. Series Arizona Press, 1992, pp. 557–593.
32. Tillman, J., Johnson, N.C., Guttorp, P., et al., The Martian Annual Atmospheric Pressure Cycle - Years Without Great Dust Storms, J. Geophys. Res., 1993, vol. 98, pp. 10963–10971.
33. Titus, T.N., Kieffer, H.H., and Christensen, P.R., Exposed Water Ice Discovered Near the South Pole of Mars, Science, 2003, vol. 299, no. 5609, pp. 1048–1051.
34. Yoder, C.F., Konopliv, A.S., Yuan, D.N., et al., Fluid Core Size of Mars from Detection of the Solar Tide, Science, 2003, vol. 300, pp. 299–303.
