")
")
Seasonal Neutron-Flux Variations in the Polar Caps of Mars as Revealed by the Russian HEND Instrument Onboard the NASA 2001 Mars Odyssey Spacecraft
M. L. Litvak1, I. G. Mitrofanov1, A. S. Kozyrev1, A. B. Sanin1, V. I. Tret'yakov1, W. V. Boynton2, C. Shinohara2, D. Hamara2, S. Saunders3, D. M. Drake4, M. T. Zuber5, 6, and D. E. Smith5
1 Space Research Institute, Russian Academy of Sciences, Profsoyuznaya 84/32, Moscow, 117997 Russia
2 Lunar and Planetary Laboratory, University of Arizona, Tucson, AZ 85721, USA
3 Jet Propulsion Laboratory, Pasadena, CA 91109, USA
4Los Alamos National Laboratory, Los Alamos, NM 87545, USA
5 Laboratory for Terrestrial Physics, NASA/Goddard Space Flight Center, Greenbelt, MD 20771, USA
6 Massachusetts Institute of Technology, Cambridge, MA 02139-4307, USA
Abstract - We analyze the flux of epithermal neutrons from the Martian surface recorded by the Russian High-Energy Neutron Detector (HEND) from February 19 through December 19, 2002. The HEND was installed onboard the NASA 2001 Mars Odyssey spacecraft and is designed to measure neutron fluxes with energies above 1 eV. Over the period of observations, statistically significant variations in the flux of epithermal (10–100 keV) neutrons were found in the northern and southern polar caps. The largest neutron-flux variations were found at subpolar latitudes, where the relative difference between the summer and winter values can reach severalfold. This correlation becomes weaker with increasing distance from the poles. Thus, the relative change in the neutron flux near the 60° parallel is slightly more than 10%. We assume that the detected variations result from the global circulation of atmospheric carbon dioxide in subpolar Martian regions. To additionally test this assumption, we compared the HEND neutron measurements onboard 2001 Mars Odyssey and the seasonal variations in the CO2-layer thickness as observed by the Mars Orbital Laser Altimeter (MOLA) onboard Mars Global Surveyor (MGS).
DOI: 10.1023/A:1026070828716 - http://www.springerlink.com/content/p484p6u0k6n3p7p0/
-------------------------------------------------------------------------------------------------------------------------------------------------
-------------------------------------------------------------------------------------------------------------------------------------------------On February 18, 2002, the 2001 Mars Odyssey acecraft was placed in a circular orbit around Mars with a period of about two hours and an altitude of 400– 450 km after an almost four-month-long aerobraking phase. Since then, a global mapping of the Martian surface with the instrumentation onboard the spacecraft has become possible.
The Russian High-Energy Neutron Detector (HEND) is part of the GRS (Gamma-Ray Spectrometer) experiment and is designed to measure neutron fluxes over a wide energy range, from 1 eV to 15 MeV, from a near-surface layer of the planet 1 to 2 m in depth.
Mars is known to possess a thin atmosphere, which is equivalent, on average, to about 1% of the Earth's atmosphere at sea level. Therefore, cosmic-ray particles reach the Martian surface with minimum loses, where they produce fast neutron fluxes. Interacting with nuclei of the near-surface layer, fast neutrons undergo elastic and inelastic interactions with the nuclei of chemical elements in the soil. The presence of even a few percent of water in the near-surface layer of the planet strongly affects the flux of fast neutrons because of the high moderation efficiency of the neutrons as they collide with the hydrogen nuclei in water molecules. The higher is the percentage of water in the soil, the more efficient is the neutron moderation, and the larger is the attenuation of the fast neutron flux when it emerges on the surface.
The Detection of Water Beneath the Surface of Mars. The first analysis of the HEND data for the Martian surface obtained during February-April 2002 revealed large regions on the surface of the planet where a significant deficit of fast neutrons relative to equatorial regions with the maximum neutron flux is observed (Mitrofanov et al., 2002; Feldman et al., 2002; Mitrofanov et al., 2003). These primarily include the huge region around the south pole of Mars higher than 60°S. It is clearly seen both in epithermal neutrons with energies 10–100 keV and in the range of fast neutrons with energies above 1 MeV. The flux of epithermal neutrons produced at a depth as large as 2 m decreased by a factor of about 10. This decrease cannot be explained by statistical fluctuations, changes in the chemical composition, and atmospheric attenuation. These effects can result in neutron-flux variations by no more than 15– 20%. The GRS data also revealed that the southern region of the epithermal neutron deficit is a source of radiation in the 2.2-MeV gamma-ray line, which is emitted when a neutron is captured by hydrogen (Boynton et al., 2002). These facts have led one to the unequivocal conclusion that a huge region of permafrost with a water ice content of about 35±15% by weight is observed in the southern hemisphere of Mars (Feldman et al., 2002; Mitrofanov et al., 2002; Boynton et al., 2002).
Over the same period of observation, regions with a large deficit of fast and epithermal neutrons were also detected in the north. Epithermal neutron mapping revealed a region with low neutron fluxes in the northern polar cap with coordinates of about 60° N and 210°- 270° E. Below, we will call it region A. In the range of fast neutrons with energies above 3 MeV, a huge region with a deficit of fast neutrons was observed around the north pole, starting from 60° N. Two more small irregularly shaped regions with a five-to-sevenfold deficit of epithermal neutrons were detected near Arabia and Memnonia.
It is assumed that the difference between the fast and epithermal neutron variations can be explained in terms of a layered soil model. Numerical calculations indicate that the observed fluxes of epithermal and fast neutrons and gamma-ray photons with energies of about 2.2 MeV can be modeled by assuming that a thick layer of soil with a very high content of water ice is overlaid with a 20 to 50-cm-thick layer of relatively dry soil with a water content of about 3–5% by weight (Boynton et al., 2002; Mitrofanov et al., 2002).
The Possibility of Measuring Seasonal Variations. The change of Martian seasons may be assumed to affect the fluxes of fast and epithermal neutrons because of the sublimation and precipitation of carbon dioxide from the atmosphere of Mars on its surface. Our paper aims at studying this question based on the HEND measurements from February 19 through December 19, 2002.
As in the case of the Earth, the Martian seasons can be explained by the inclination of the rotation axis of the planet to the plane of its orbit around the Sun. The principal distinction between Mars and the Earth, which significantly affects the seasonal variations on this planet, is that its orbit around the Sun is highly elliptical. Mars revolves around the Sun in a highly eccentric orbit with a distance difference from 1.37 to 1.64 AU. Because of the orbital ellipticity, the difference between the seasons in the north and the south of Mars is much larger than that on Earth.
Since 2001 Mars Odyssey is conducting a global mapping of the planet from a polar, nearly circular orbit, neutron measurements allow the antiphase seasonal variations in the north and the south to be simultaneously studied. We take the vernal equinox, when spring and autumn begin at the north and south poles, respectively, as the starting reference point. As this equinox occurs on April 18, 2002, by the terrestrial calendar, the first 2001 Mars Odyssey measurements provided a unique opportunity to trace the seasonal winter/ spring/summer and summer/autumn/winter transitions in the northern and southern hemispheres, respectively.
Normalization of the Neutron Flux Relative to the Identified Geographic Region
The neutron flux averaged over the observed geographic region serves as the main parameter that characterizes the surface composition and seasonal variations. However, the absolute neutron flux depends not only on changes in the percentage of water in the nearsurface layer of the region under study but also on external factors.
First, the flux is significantly affected by enhanced solar activity, which causes a considerable increase in the flux of charged particles. Therefore, we excluded the periods of high solar activity from our analysis. Since there are no patrol measurements of solar activity from Mars, residual manifestations of solar flares can be present in the data. These manifestations can change the absolute flux by several percent. This implies that, having found a statistically significant change of the absolute flux in some region, we still cannot assert with certainty whether it is related to a change in the concentration of water in the soil or to residual manifestations of solar flares.
Second, similar neutron-flux variations can be caused by variations in the flux of Galactic cosmic rays, because the conditions of their interaction with the heliosphere change. These variations also make it difficult to reliably interpret the results obtained.
To get rid of these external factors, we use below a normalized neutron flux. For the normalization, we chose a reference region with coordinates from 240° E to 330° E and from 50° S to 30° N, where the maximum flux of epithermal neutrons is observed throughout the period of measurements. This is the driest place on Mars unsusceptible to the seasonal variations caused by global carbon dioxide circulation. External factors, such as, for example, solar flares or cosmic-ray flux variations, play a major role in the neutron-flux variations in this region.
Thus, by normalizing the data for the chosen time interval to the neutron flux in this region, we get rid of external factors, leaving only the neutron-flux variations caused by hydrological processes and seasonal variations.
Relating the Orbital Neutron Measurements to the Water Content in a Homogeneous Layer of Soil. The near-surface water-content measurements obtained by the Viking-1 lander at the landing site in the western part of Chryse Planitia with coordinates 22°.482 N and 312°.032 E (Arvidson et al., 1989) can be used to pass from the observed neutron fluxes to the percentage of water. Obviously, a direct comparison of the orbital and in-situ measurements is not quite proper, because these measurements have different spatial resolutions. Moreover, the Viking-1 estimate of the percentage of water in the near-surface layer is inaccurate, because it was obtained by indirect measurements (for more detail, see Basilevsky et al., 2003). We can only argue that the amount of chemically bound water in the analyzed rock samples varies between 0.1% and 3%. It is well known from the HEND neutron observations (Mitrofanov et al., 2002; Mitrofanov et al., 2003) that the maximum neutron flux is observed in subequatorial regions near Solis Planum. Given the correlation between the generation of epithermal neutrons and the near-surface water content of the planet, this can be assumed to be the driest place on Mars. The estimate of the water content in a specific pixel of the map depends on what content is assumed in the region with the maximum neutron flux. Using Viking-1 data, we can assume that the water content at the driest point of the planet may vary between zero and 1.5%.
This is a rough estimate. However, until a large number of direct surface neutron measurements will be accumulated, this comparison is essentially the only possibility to pass from relative neutron-flux variations in different pixels of the map to quantitative estimates of the water content in the corresponding regions.
Here, we do not use the Mars Pathfinder and Viking-2 measurements of the soil water content. The Mars Pathfinder results provide no new information for our study, because the Viking-1 and Mars Pathfinder landing sites were very close in geographic coordinates and give comparable estimates of the water content (for more detail, see Basilevsky et al., 2003). The Viking-2 landing site was approximately 20° closer to the north pole (Arvidson et al., 1989). The HEND data (Mitrofanov et al., 2003) show that the Viking-2 landing site on Utopia Planitia with coordinates of 47.996° N and 134.264° E is probably located at the southern boundary of the northern permafrost region. In this case, the model of a homogeneous layer is inapplicable, because a lower layer with a high water content lies in the permafrost areas most likely beneath the upper dry soil. The Viking-2 measurements pertain to the uppermost dry layer, while the orbital measurements give the composition of a deeper layer. Therefore, comparison of the orbital and in-situ measurements is not quite proper in this case.
Assuming that the maximum neutron flux corresponds to ~1% of water and using the model of homogeneous soil (Fig. 1), we can divide the entire observed range of relative normalized epithermal neutron fluxes into three narrower ranges, > 0.75, 0.32–0.75, and < 0.32, which correspond to the red, yellow, and blue regions in the maps (Fig. 2), respectively.
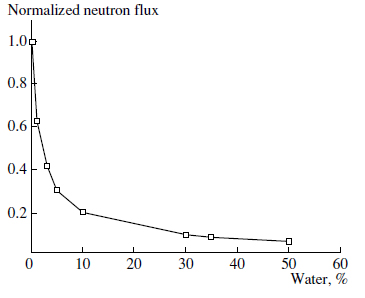
Fig. 1. The normalized epithermal neutron flux recorded in the MD counter versus the water content in a homogeneous layer of soil.
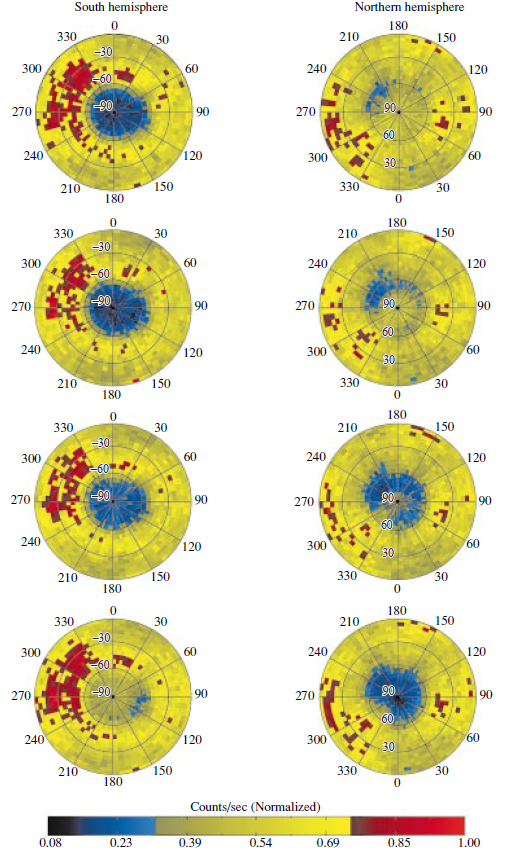
Fig. 2. Polar projections for the water-content maps constructed by recording epithermal neutrons from the Martian surface and by normalization to 1% of water in the near surface layer near Solis Planum, where the maximum flux is observed. The red, yellow, and blue colors correspond to the presence of water <2%, from 2% to 10%, and >10%, respectively. The first three maps (from the top downward) were constructed for the periods with Ls = 330°-350°, Ls = 12°-28°, and 44°-68°, respectively. The bottom curve corresponds to the period with Ls = 81°-108°.
The red color corresponds to the presence of < 2% of water by mass in the near-surface layer. It is well known that physically bound (adsorbed) water in the soil can account for up to 1% in order of magnitude (Mohlmann, 2002). Therefore, the neutron-flux variations within the range corresponding to the red color can be explained by a number of factors, such as variations in elemental surface composition and the presence of adsorbed or even chemically bound water. The amount of chemically bound water can account for up to 10% by mass (Basilevsky et al., 2003). In that case, the yellow color on the map, which corresponds to the presence of 2 to 10% of water in the soil, shows the abundance of regions dominated by chemically bound water. Finally, the blue color on the map corresponds to the presence of more than 10% of water. This amount of water is difficult to explain by the presence of only adsorbed or chemically bound water (Basilevsky et al., 2003). The assumption about the presence of free water ice in the soil is required to explain the high water content (> 10%).
In the presence of free water ice in the soil, the model of a homogeneous layer is probably invalid. Multilayer models, the simplest of which is a two-layer model with relatively dry regolith at the top and with a mixture of soil and water ice at the bottom, should be considered. This model has already been used to analyze the neutron fluxes in the southern subpolar region of Mars (Mitrofanov et al., 2002; Boynton et al., 2002). Thus, we can argue that the blue color on the neutron maps of Mars indicates the permafrost regions in which the layers with a large amount of water ice are covered by a layer of relatively dry soil.
Constructing the Seasonal Maps of Epithermal Neutrons
The solar longitude of Mars can be used as a time parameter that characterizes the seasonal variability on Mars. This quantity Ls is defined as the angle between the Mars–Sun direction at the current epoch and the Mars–Sun direction at the vernal equinox. Thus, the beginning of spring and summer at the north pole are characterized by Ls= 0° and Ls= 90°, respectively.
The entire observing period of nine months, from February 19 through December 19, 2002, can be broken down into several intervals, which provide sufficient volumes of data for statistically confident mapping. The confidence requirement corresponds to the condition that the apparent differences between the maps are significant and cannot be explained by statistical fluctuations in the accumulated count statistics. The observational data lead us to conclude that this time interval is about one month (the change in Ls is ~15°) if a 5°x5° area is chosen as a pixel on the map. In this case, the minimum measurable flux of epithermal neutrons on the map of Mars has a statistical confidence of about 5σ above the background.
As the background level, we took the neutron flux from the spacecraft in free space measured far from Mars that was reduced by a factor of 1 – ΔΩ/4π to allow for the solid angle ΔΩ that Mars occupies in the field of view of the orbiting spacecraft.
If the gamma-ray data from the external HEND scintillator indicated an increase in the flux of energetic particles from the Sun during the chosen observing period, then these periods were excluded from the neutron mapping data. Since strong solar flares can last for several days, the accumulation time interval of one map was increased to ensure the necessary statistical confidence level. This also applies to the time intervals when interruptions in data transmission from the spacecraft to the Earth arose. Such a situation, for example, took place during August 2002, when the Sun was between the Earth and Mars. As a result of these corrections, the data accumulation time interval was 1.5 to 2 months in several cases.
To make it easier to perceive the dynamics of the epithermal neutron flux variations with geographic location and season, we decided to use three-color maps for which the neutron-flux gradation within one color is reflected by a change in brightness. Three-color maps are convenient, because we know the relationship between the type of soil water and the range of its percentage (see the previous section). Therefore, each color can be assigned to one of the three types of water in the Martian soil. The measured epithermal neutron flux is a direct measure of the near-surface water composition on the planet. Hence, the three-color epithermal neutron map can be represented as an abundance map of various types of water and its percentage.
SEASONAL NEUTRON-FLUX VARIATIONS AT VARIOUS LATITUDES
Seasonal Variations in the Observed Boundaries of the Permafrost Regions. We studied the dependence of the epithermal neutron flux on the change of Martian seasons by using neutron data from the MD detector of the HEND. This detector was made from an industrial LND 2517 proportional counter with 3He surrounded by a 12-mm-thick polyethylene moderator. Its efficiency is at a maximum in the energy range 1– 100 keV (Mitrofanov et al., 1999).
Figure 2 shows four maps of the normalized epithermal neutron flux in polar projections for late northern summer (Ls= 330°-350°), early northern spring (Ls= 12°-28°), late northern spring (Ls= 44°-68°), and early northern summer (Ls= 81°-108°). It can be easily seen from a comparison of these maps that the epithermal neutron flux varies with Martian season. The neutron- flux variations are most pronounced in the northern and southern permafrost regions at latitudes higher than 60° N and 60° S, respectively.
Beginning from the vernal equinox Ls= 0°, the small blue island (i.e., an area where more than 10% of water is present) with coordinates of about 60° N and 210°-270° E (region A; see the Introduction) expands, gradually filling the arc-shaped region along 60° N. By the end of the described observing period (the time corresponds to Ls= 110°), the blue region completely covers the entire northern region of the planet higher than 60° N. By this time, the winter seasonal carbon dioxide cover in the north has completely disappeared to expose the surface of the northern permafrost region.
In the south, the observed permafrost region (blue) is virtually unchanged until the phase of late southern autumn Ls ~ 75°. Only on the last map do we see how this region began to shrink. At the same time, on the first three maps, we see how its color began to change from dark-blue in northern summer to bright-blue in early southern summer. These changes imply autumnal carbon dioxide condensation on the surface of the southern permafrost region. As a result of the condensation, the percentage of water in the observed nearsurface layer 1 to 2 m thick drops below the 10% level.
Figure 3 shows seasonal variations in the apparent sizes of the northern and southern Martian regions with a given water content in the near-surface layer. We clearly see that the area of this surface monotonically increases in the north throughout the spring, covering about 5–6% of the Martian surface by early summer. A similar region in the south, being almost unchanged in size, varies within the same 5–6% during late southern summer and early autumn with Ls = 330°-50°. After Ls = 50°, measurements show that carbon dioxide condensation began in the south and that the apparent size of the southern region began to rapidly decrease. Comparison of the curves for the northern and southern permafrost regions indicates that these two regions together cover up to 15% of the entire Martian surface.
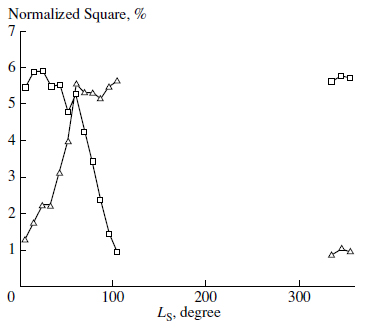
Fig. 3. The observed area of the surface with more than 10% of water versus Ls. The heavy and thin lines indicate the dependences for the regions around the south and north poles, respectively.
Latitudinal Effects in Seasonal Neutron-Flux Variations. To study the latitude dependence of seasonal carbon dioxide deposits, we divided the northern and southern regions of Mars into 10° latitude belts. We chose the northern/southern subpolar belts with latitudes 75°-85°, the middle latitude belts with latitudes 65°-75°, and the boundary latitude belts with coordinates 55°-65°. In Figs. 4 and 5, the average epithermal neutron flux is plotted against Ls for each latitude belt in the north and the south. We clearly see from the presented data that the variations in the north and the south are in antiphase. In the north, the neutron flux monotonically decreases from high winter values with Ls = 330°-360° to low values of early northern summer with Ls > 90°. By the time with Ls = 110°, the curves of the average flux for all of the northern latitude belts were constant. They decreased by a factor of 3, 1.7, and 1.2, respectively.
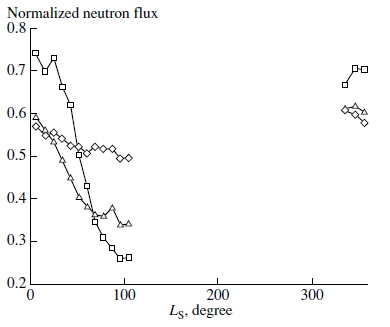
Fig. 4. The normalized epithermal neutron flux versus Ls for various latitude belts within the northern province. The squares, triangles, and diamonds indicate the dependences for the latitude belts 75°-85° N, 65°-75° N, and 55°-65° N, respectively.
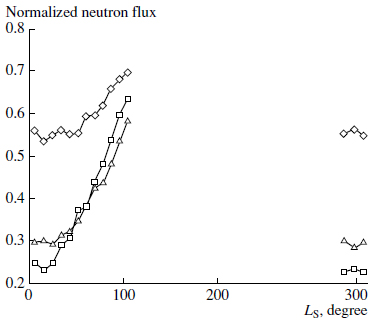
Fig. 5. The normalized epithermal neutron flux versus Ls for various latitude belts within the southern province. The squares, triangles, and diamonds indicate the dependences for the latitude belts 75°-85° S, 65°-75° S, and 55°-65° S, respectively.
In contrast, for the southern region in the same period of the Martian year, all of the three curves corresponding to the subpolar, middle, and boundary belts monotonically rise starting from different times. For the boundary latitude belt, this rise begins at the time with Ls = 50° and is a factor of about 1.3 by the time with Ls = 110°. For the middle and subpolar latitude belts, the initial times correspond to Ls = 30° and Ls = 15°, respectively; the relative increase in neutron flux by the time with Ls = 110° is a factor of 2 and 2.5, respectively.
Our results confirm the assumption about the latitude dependence in seasonal epithermal neutron flux variations and show that the observed variations are in antiphase between the northern and southern hemispheres. The decrease in the flux of epithermal neutrons in the north suggests that carbon dioxide evaporates to expose the water-ice-rich surface of the northern permafrost region for measurements. Over the same period, events in the southern hemisphere develop in the reverse sequence: the epithermal neutron flux increases because of the condensation of carbon dioxide, which hides the surface of the southern permafrost region from observations.
Thus, prolonged observations of the high-latitude northern and southern Martian regions allow us not only to study the permafrost regions located there but also to elucidate the patterns of condensation and evaporation of the seasonal carbon dioxide covers. The latitude difference between these regions is 30°, and the elevation difference is several kilometers. Therefore, neutron measurements allow us to study the seasonal variations for areas with different surface properties. Using the seasonal dependences of the neutron flux, we can compare the summer fluxes in the northern and southern provinces when there is virtually no CO2 cover (see Mitrofanov et al., 2003).
For this comparison, we chose the times with Ls = 110° for the north and Ls = 330° for the south. At the time corresponding to Ls = 110°, all of the curves showing a change of the neutron flux in the northern latitude belts flattened out, which can be interpreted as complete carbon dioxide evaporation in these regions. On the other hand, the time with Ls = 330° for the southern latitude belts also occurred in the time interval when there was no CO2 snow cover in the southern regions. We clearly see from Figs. 4 and 5 that the average epithermal neutron flux is ~0.25 for the southern and northern subpolar latitude belts. The fluxes for the northern and southern middle latitude belts are ~0.33 and ~0.3, respectively. For the boundary regions, the corresponding values are 0.5 and 0.55. Thus, the first comparison indicates that the stable neutron fluxes in the absence of CO2 are close in magnitude, implying that the northern and southern permafrost provinces are similar not only in size but also in the amount of observed ice in the near-surface layer. The north and south most likely have a similar structure of the soil, which is composed of an upper dry regolith layer and a lower layer with a high content of water ice exceeding several tens of percent. If we proceed from the estimates made in previous studies of the water content in the near-surface layer at the south pole, then we may say that permafrost at the north pole can vary between 20% and 50% by mass (Boynton et al., 2002).
A Numerical Model of Permafrost Regions with Variable Carbon Dioxide Cover. Since, as we noted above, the neutron flux depends on the composition of the entire observed near-surface layer, the estimate of the seasonal CO2 cover is model-dependent.
We used several models of Martian soil with an underlying permafrost layer. In these models, the soil is assumed to have a layered structure, where the thin upper layer of variable thickness contains 3% of water and the lower layer contains 35% of water by mass and goes deep to infinity. The chemical composition of the soil was determined from Viking-1 and -2 data (Dagge et al., 1991). The chose of 35% of ice in the lower layer is based on the paper by Boynton et al. (2002), who estimated the water content in the near-surface layer for southern subpolar regions by analyzing neutron and gamma-ray measurements. If the northern and southern permafrost regions are assumed to be identical (as suggested by the latitude dependence of the neutron flux for the north and the south), then this estimate of the water content for the north seems quite appropriate.
The significant deficit of fast neutrons (Mitrofanov et al., 2002; Mitrofanov et al., 2003) emerging in a 20 to 30-cm-thick upper layer of soil in subpolar regions suggests that the water content here can be severalfold higher than that at equatorial latitudes. Therefore, the water content estimate of 3% in the uppermost layer of soil for subpolar latitudes seems justified. Since permafrost approaches close to the surface at subpolar latitudes (Boynton et al., 2002), we used a model with a variable thickness of the upper layer for our calculations.
The epithermal neutron flux is plotted against the thickness of the carbon dioxide layer on the permafrost surface in Fig. 6 for models of soil with 10-, 20-, and 40-g/cm2-thick upper layers. For these model curves, we used the normalization to the neutron flux calculated for a homogeneous model with dry soil (the water content is ~1.5%).
If we again turn to Fig. 4 and look at the time dependence of the neutron flux for the northern subpolar belt, then we can see that the stable flux corresponding to the total absence of CO2 snow cover is reached in the range of relative fluxes from 0.2 to 0.3. Comparison of these values with the model curves in Fig. 6 (the model points where the depth of the CO2 snow cover is zero) indicates that the closest agreement is achieved for the models of soil with dry upper layers from 10 to 20 g/cm2 in thickness. According to these models, the change in relative neutron flux by a factor of 3 for the northern subpolar belt from its minimum (the total or almost total absence of CO2, Ls = 110°) to its maximum (maximum CO2 thickness, Ls ~ 330°-360°) is attributable to the presence of a 60 to 80-cm (on average) cover of frozen carbon dioxide (see Fig. 6).
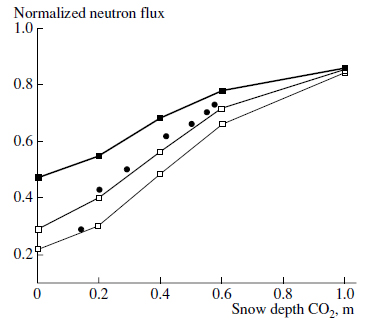
Fig. 6. The normalized neutron flux versus snow depth for the models of Martian soil with a dry upper layer of 10 (thin line), 20 (intermediate-thickness line), and 40 (thick line) g/cm2 in thickness. Each of the models assumes the presence of 35% of water by mass in the lower infinite layer. The filled circles indicate the experimental dependence constructed from HEND and MOLA data within the northern subpolar latitude belt.
Comparison of the HEND and MOLA Thickness Estimates for the Seasonal Carbon Dioxide Layer. To check the model description of the variable CO2 layer in the permafrost regions, we quantitatively compared the HEND data with the MOLA (Mars Orbiter Laser Altimeter)/Mars Global Surveyor measurements of the seasonal variations in local elevation (Smith et al., 1999). The MOLA instrument is known to have directly measured the geometrical thickness of the carbon dioxide cover. This makes it possible to quantitatively compare the model CO2 thickness estimates based on HEND neutron measurements and the actual measurements of the snow depth performed for the past Martian year.
According to the MOLA data, the thickness of the seasonal CO2 cover in the north reaches its maximum in the period with Ls = 340°-345°. In this case, the change in elevation relative to the zero level is 1.2 to 1.5 m for latitudes higher than 85° N. Starting from this time, the cover elevation gradually decreases, and this decrease in elevation for the season with Ls > 90° is more than a factor of 2. A similar seasonal change in surface elevation is observed up to 70° N. At the same time, the reverse is observed in the southern hemisphere. Starting from the season with Ls = 320°-330°, a slow, but statistically significant increase in the observed surface elevation occurs; this increase reaches its maximum at the time with Ls = 120° (Smith et al., 2001).
The MOLA and HEND data were obtained in different Martian years, but they can be compared for similar seasons. We compared the direct MOLA measurements of the average carbon dioxide thickness in the northern subpolar latitude belt 75°-85° N and the HEND measurements of the average neutron flux in this latitude belt in similar periods of the Martian year. The data points obtained were added to Fig. 6 (filled circles). There is agreement between the numerical model of soil with an upper layer of about 20 g/cm2 in thickness, which relates the neutron flux to the estimated thickness of the seasonal carbon dioxide cover, and the direct MOLA measurements of the CO2 thickness.
Thus, we obtained both qualitative and modeldependent quantitative agreement between the estimates of the seasonal CO2 cover above the northern permafrost region and the neutron measurements. These results will be tested in a year, after data on a similar seasonal cycle in the south will be obtained, and in two years, after the seasonal cycle in the north will be measured once again.
RELATIONSHIP BETWEEN THE LONGITUDINAL NEUTRON-FLUX VARIATIONS
AND THE SEASONAL CIRCULATION OF ATMOSPHERIC CARBON
DIOXIDE IN THE NORTHERN HEMISPHERE OF MARS
In the preceding section, we studied the seasonal variations in the thickness of carbon dioxide for the latitude belts within which the neutron fluxes were longitudinally averaged. However, the global maps of the epithermal neutron flux (Fig. 2) indicate that within these latitude belts, the neutron-flux variations with longitude reach several hundred percent. These variations are most likely attributable to different properties of the Martian surface at different points of observation.
Of greatest interest in searching for longitudinal neutron-flux variations are the northern latitude belts of permafrost 55°-65° N and 65°-75° N. Region A (see the Introduction) with extremely low neutron fluxes is contained in these belts. This northern region was separately considered at the initial stage of neutron mapping of Mars (Mitrofanov et al., 2003). The neutronflux observations showed the presence of more than 10% of water (see the upper map in Fig. 2) even during northern winter, when the surface of this region was covered by a thick layer of CO2 snow. The seasonal epithermal neutron flux variations in these latitude zones began at Ls = 0° and ended at Ls = 70°, implying that two observed periods of stable seasonal conditions with Ls from 330° to 350° during northern winter and with Ls from 70° to 90° in later northern spring exist for these belts.
The significant difference between the neutron fluxes inside region A and in the neighboring regions at the same latitude may be assumed to result from different thicknesses of the CO2 cover. In this case, the winter–summer transition within a given latitude belt will be nonuniform for different latitudes. The reason is that in some areas, the snow cover has already completely sublimated (the neutron flux is stable), while in other areas, this process is still continuing (neutron-flux variations are seen). To test this hypothesis, we compared the longitudinal curves of the epithermal neutron flux constructed for different seasons. In Fig. 7, the epithermal neutron flux is plotted against longitude at 5° steps along the middle northern belt 65°-75° N for northern winter with Ls = 330°-350° (heavy line) and northern spring with Ls = 70°-90° (thin dotted line).
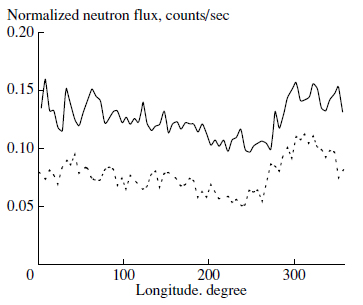
Fig. 7. The epithermal neutron flux versus longitude within the northern middle latitude belt (65°-75° N) during northern winter (heavy line) and northern spring (thin dotted line).
The shape of these curves does not depend on the season. Comparison of the two longitudinal curves of the neutron flux for northern winter and northern spring shows that the spring longitudinal curve of the neutron flux corresponds to a decrease in flux by approximately the same value relative to the winter longitudinal curve, irrespective of the longitude.
It thus follows that the longitude dependence of the neutron flux along the northern latitude belts is unrelated to the difference in the thickness of the seasonal carbon dioxide layer. The CO2 thickness at different elevations is approximately the same, and the spring evaporation of carbon dioxide causes a uniform decrease in neutron flux at all longitudes without distorting the shape of the longitudinal curve of the neutron flux.
We have studied the time interval of nine months starting from February 19, 2002, which corresponds to the period of winter/spring/summer seasonal variations at the north pole of Mars. Analysis of our data indicates that the epithermal neutron flux varies with Martian season. We found that the average epithermal neutron flux decreased in the northern province and increased in the southern province. A natural explanation of the observed seasonal variations in epithermal neutron flux is the global seasonal circulation and redistribution of CO2 during the Martian year.
In northern spring, the upper layer of frozen CO2 begins to sublimate into the atmosphere because of the rise in temperature. At this time, the summer ends and the autumn begins in the south. The seasonal fall of temperature in the south below the CO2 condensation point results in the precipitation of atmospheric carbon dioxide on the Martian surface in the form of a snow cover (Forget, 1998). Since epithermal neutrons are generated in a near-surface layer as deep as 1 or 2 m, a thickness of frozen CO2 of the same order of magnitude significantly changes the observing conditions. In the north, as the spring begins and the cover of frozen CO2 evaporates, deeper water-ice-rich layers of the Martian surface become observable. In contrast, in the south, permafrost is hidden beneath the cover of dry carbon dioxide ice, because the upper layer becomes thicker due to CO2 that fell in the form of snow.
The revealed latitude dependence of the neutron flux on the change of seasons shows that the largest amount of CO2 snow precipitates in subpolar regions, gradually decreasing with increasing distance from the poles. A model-dependent estimate based on HEND data indicates that the maximum thickness of the CO2 cover in subpolar regions can reach, on average, 60–80 cm for a thickness of the upper soil layer of 10–20 g/cm2 and 35% of water ice in the lower layer of permafrost.
The thickness of the CO2 cover estimated from neutron measurements is in good agreement with the direct MOLA measurements of the snow depth in subpolar regions. The best agreement between the HEND and MOLA experimental data points was found to be achieved when the thickness of the dry upper layer is ~20 g/cm2 and the lower layer contains about 35% of water by mass.
The first Martian surface mapping revealed nonuniformities in the longitude distribution of epithermal neutrons in northern subpolar regions. We found the large region A with extremely low neutron fluxes, showing the highest water content in the near-surface layer. Since the entire soil surface within the latitude belt under consideration is covered by a CO2 layer during northern winter, we could have assumed that the detected local deficit of neutrons in region A is related to the minimum thickness of the carbon dioxide cover through which the permafrost surface is seen. However, this effect is not observed when comparing the data accumulated during northern winter and late northern spring.
The water content in the near-surface layer of Mars can be comprehensively studied only during prolonged observations of the planet, when it will be possible to eliminate effects related to the neutron-flux variability because of the seasonal CO2 covers. On the other hand, by studying this seasonal neutron-flux variability of Mars, we can construct a physical model for the seasonal circulation of carbon dioxide in the atmosphere and on the surface of Mars. To obtain reliable results, it is desirable to continue the 2001 Mars Odyssey mission for two or three more years.
Arvidson, R.E., Gooding, J.L., and Moore, H.J., The Martian Surface as Imaged, Sampled, and Analyzed by the Viking Landers, Rev. Geophys., 1989, vol. 27, pp. 39–60.
Basilevsky, A.T., Litvak, M.L., Mitrofanov, I.G., et al., Search for Traces of Chemically Bound Water in the Surface Layer of Mars Based on Measurements with the HEND Instrument onboard 2001 Mars Odyssey, Astron. Vestn., 2003, vol. 37, no. 5, pp. 387–396.
Boynton, W.V., Feldman, W.C., Squyres, S.W., et al., Distribution of Hydrogen in the Near Surface of Mars: Evidence for Subsurface Ice Deposits, Science, 2002, vol. 297, pp. 81–85.
Dagge, G., Dragovitsch, P., Filges, D., and Bruchner, J., Monte Carlo Simulation of Martian Gamma-Ray Spectra Induced by Galactic Cosmic-Rays, Proc. Lunar Planet. Sci., 1991, vol. 21, pp. 425–435.
Feldman, W.C., Boynton, W.V., Tokar, R.L., et al., Global Distribution of Neutrons From Mars: Results From Mars Odyssey, Science, 2002, vol. 297, pp. 75–78.
Forget, F., Mars CO2 Ice Polar Cap, Solar System Ices 477-507, Schmitt, B., Ed., Kluwer: Academic, 1998.
Mitrofanov, I.G., Anfimov, D.S., Boynton, W.V., et al., Russian High Energy Neutron Detector HEND for Mars Surveyor Orbiter 2001 Mission, LPSC XXX, 1999, abstract no. 1550.
Mitrofanov, I.G., Anfimov, D.S., Kozyrev, A.S., et al., Maps of Subsurface Hydrogen From High Energy Neutron Detector, Science, 2002, vol. 297, pp. 78–81.
Mitrofanov, I.G., Litvak, M.L., Kozyrev, A.S., et al.,The First Results of Neutron Mapping of Mars by the Russian HEND Instrument onboard the US 2001 Mars Odyssey spacecraft, Astron. Vestn., 2003, vol. 37, no. 5, pp. 366–377.
Mohlmann, D., Adsorption Water in Mid and Low Latitude Martian Soil, Proc. Second European Workshop on Exo-Astrobiology, 2002, SP-518, pp. 169–172.
Smith, D.E., Zuber, M.T., Solomon, S.C., et al., The Global Topography of Mars and Implications for Surface Evolution, Science, 1999, vol. 284, no. 5419, p. 1495.
Smith, D.E., Zuber, M.T., and Neumann, G.A., Seasonal Variations of Snow Depth on Mars, Science, 2001, vol. 294, no. 5549, pp. 2141–2146.
